ERAA 2023 EditionACER's approved and amended version
Key takeaways
The ERAA 2023 shows that in the given scenario and methodology framework, high volumes of fossil-fuelled capacity are at risk of becoming economically non-viable in the next five years. In that context, the right incentives and/or targeted intervention will be necessary to avoid adequacy risks.
Adequacy issues in one country are highly dependent on assumptions in neighbouring countries – and, reciprocally, any capacity investment in one country can greatly influence its neighbours. This highlights the importance of regional coordination in decision-making.
Growing variability in supply requires the implementation of new flexibility tools that facilitate the management of demand (ramps and peaks). It further necessitates capacity that can quickly respond to sudden variation of demand and supply, for example to meet demand spikes in the evening with decreasing photovoltaic (PV) supply.
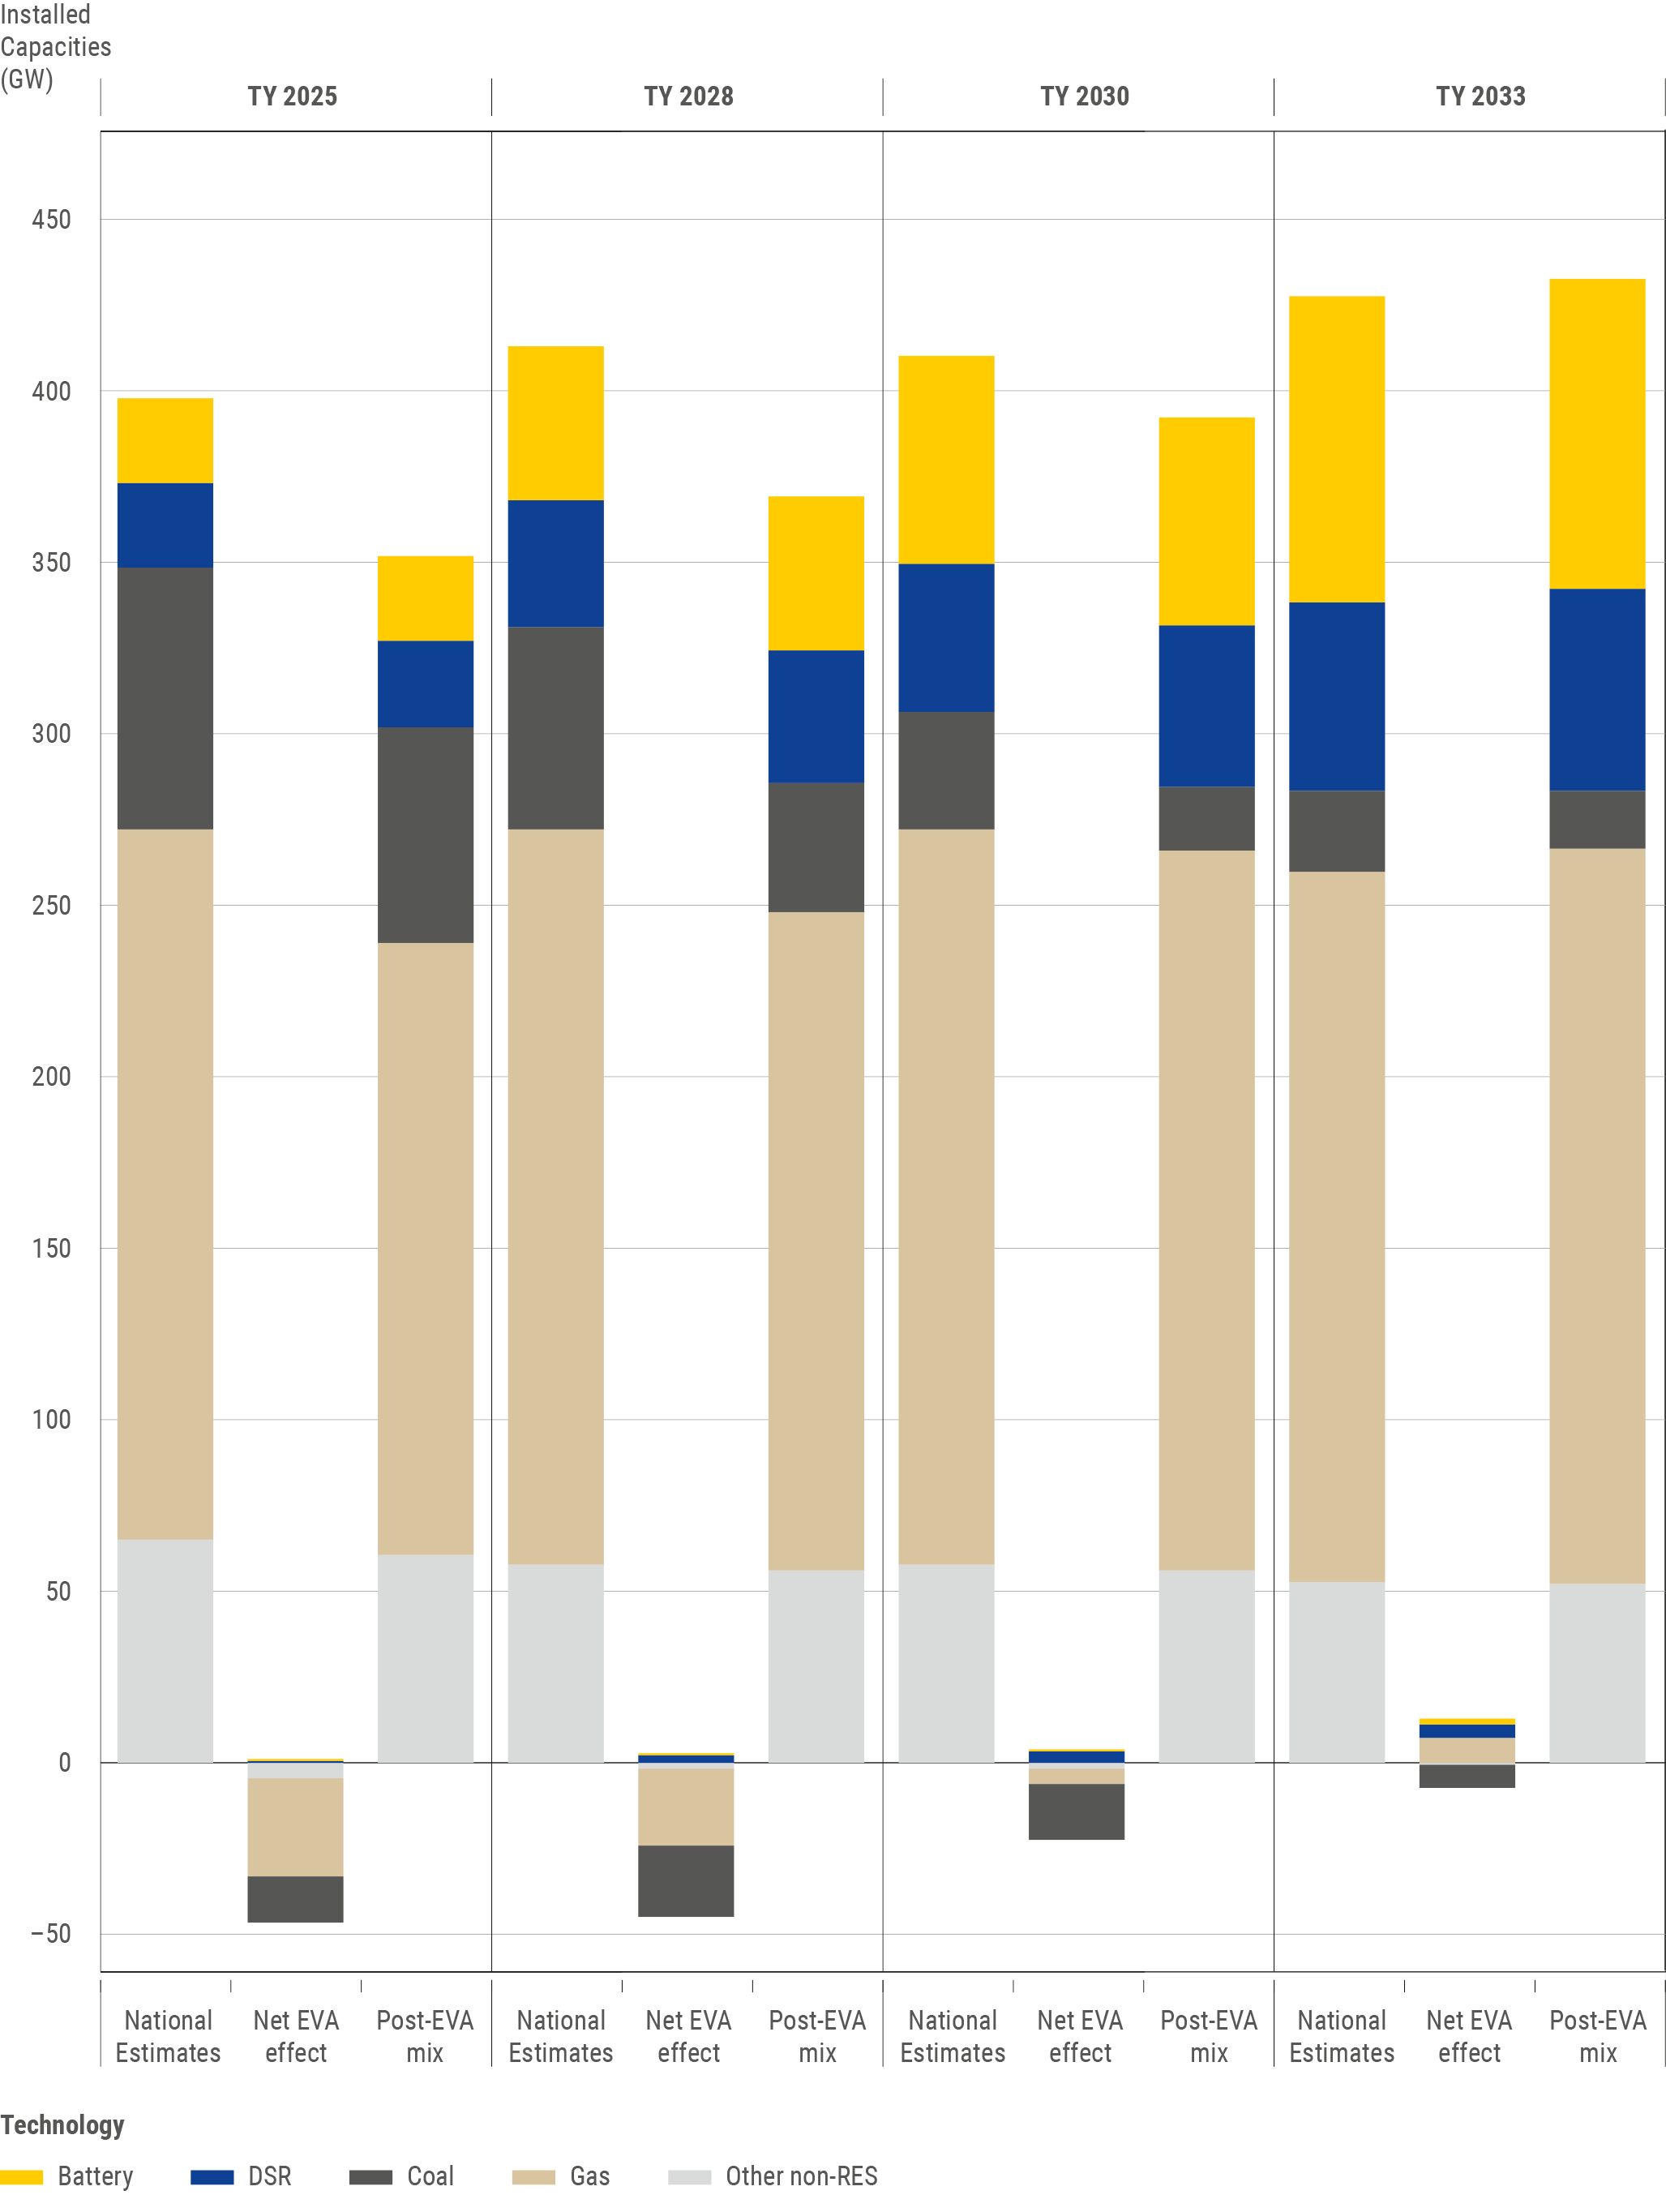
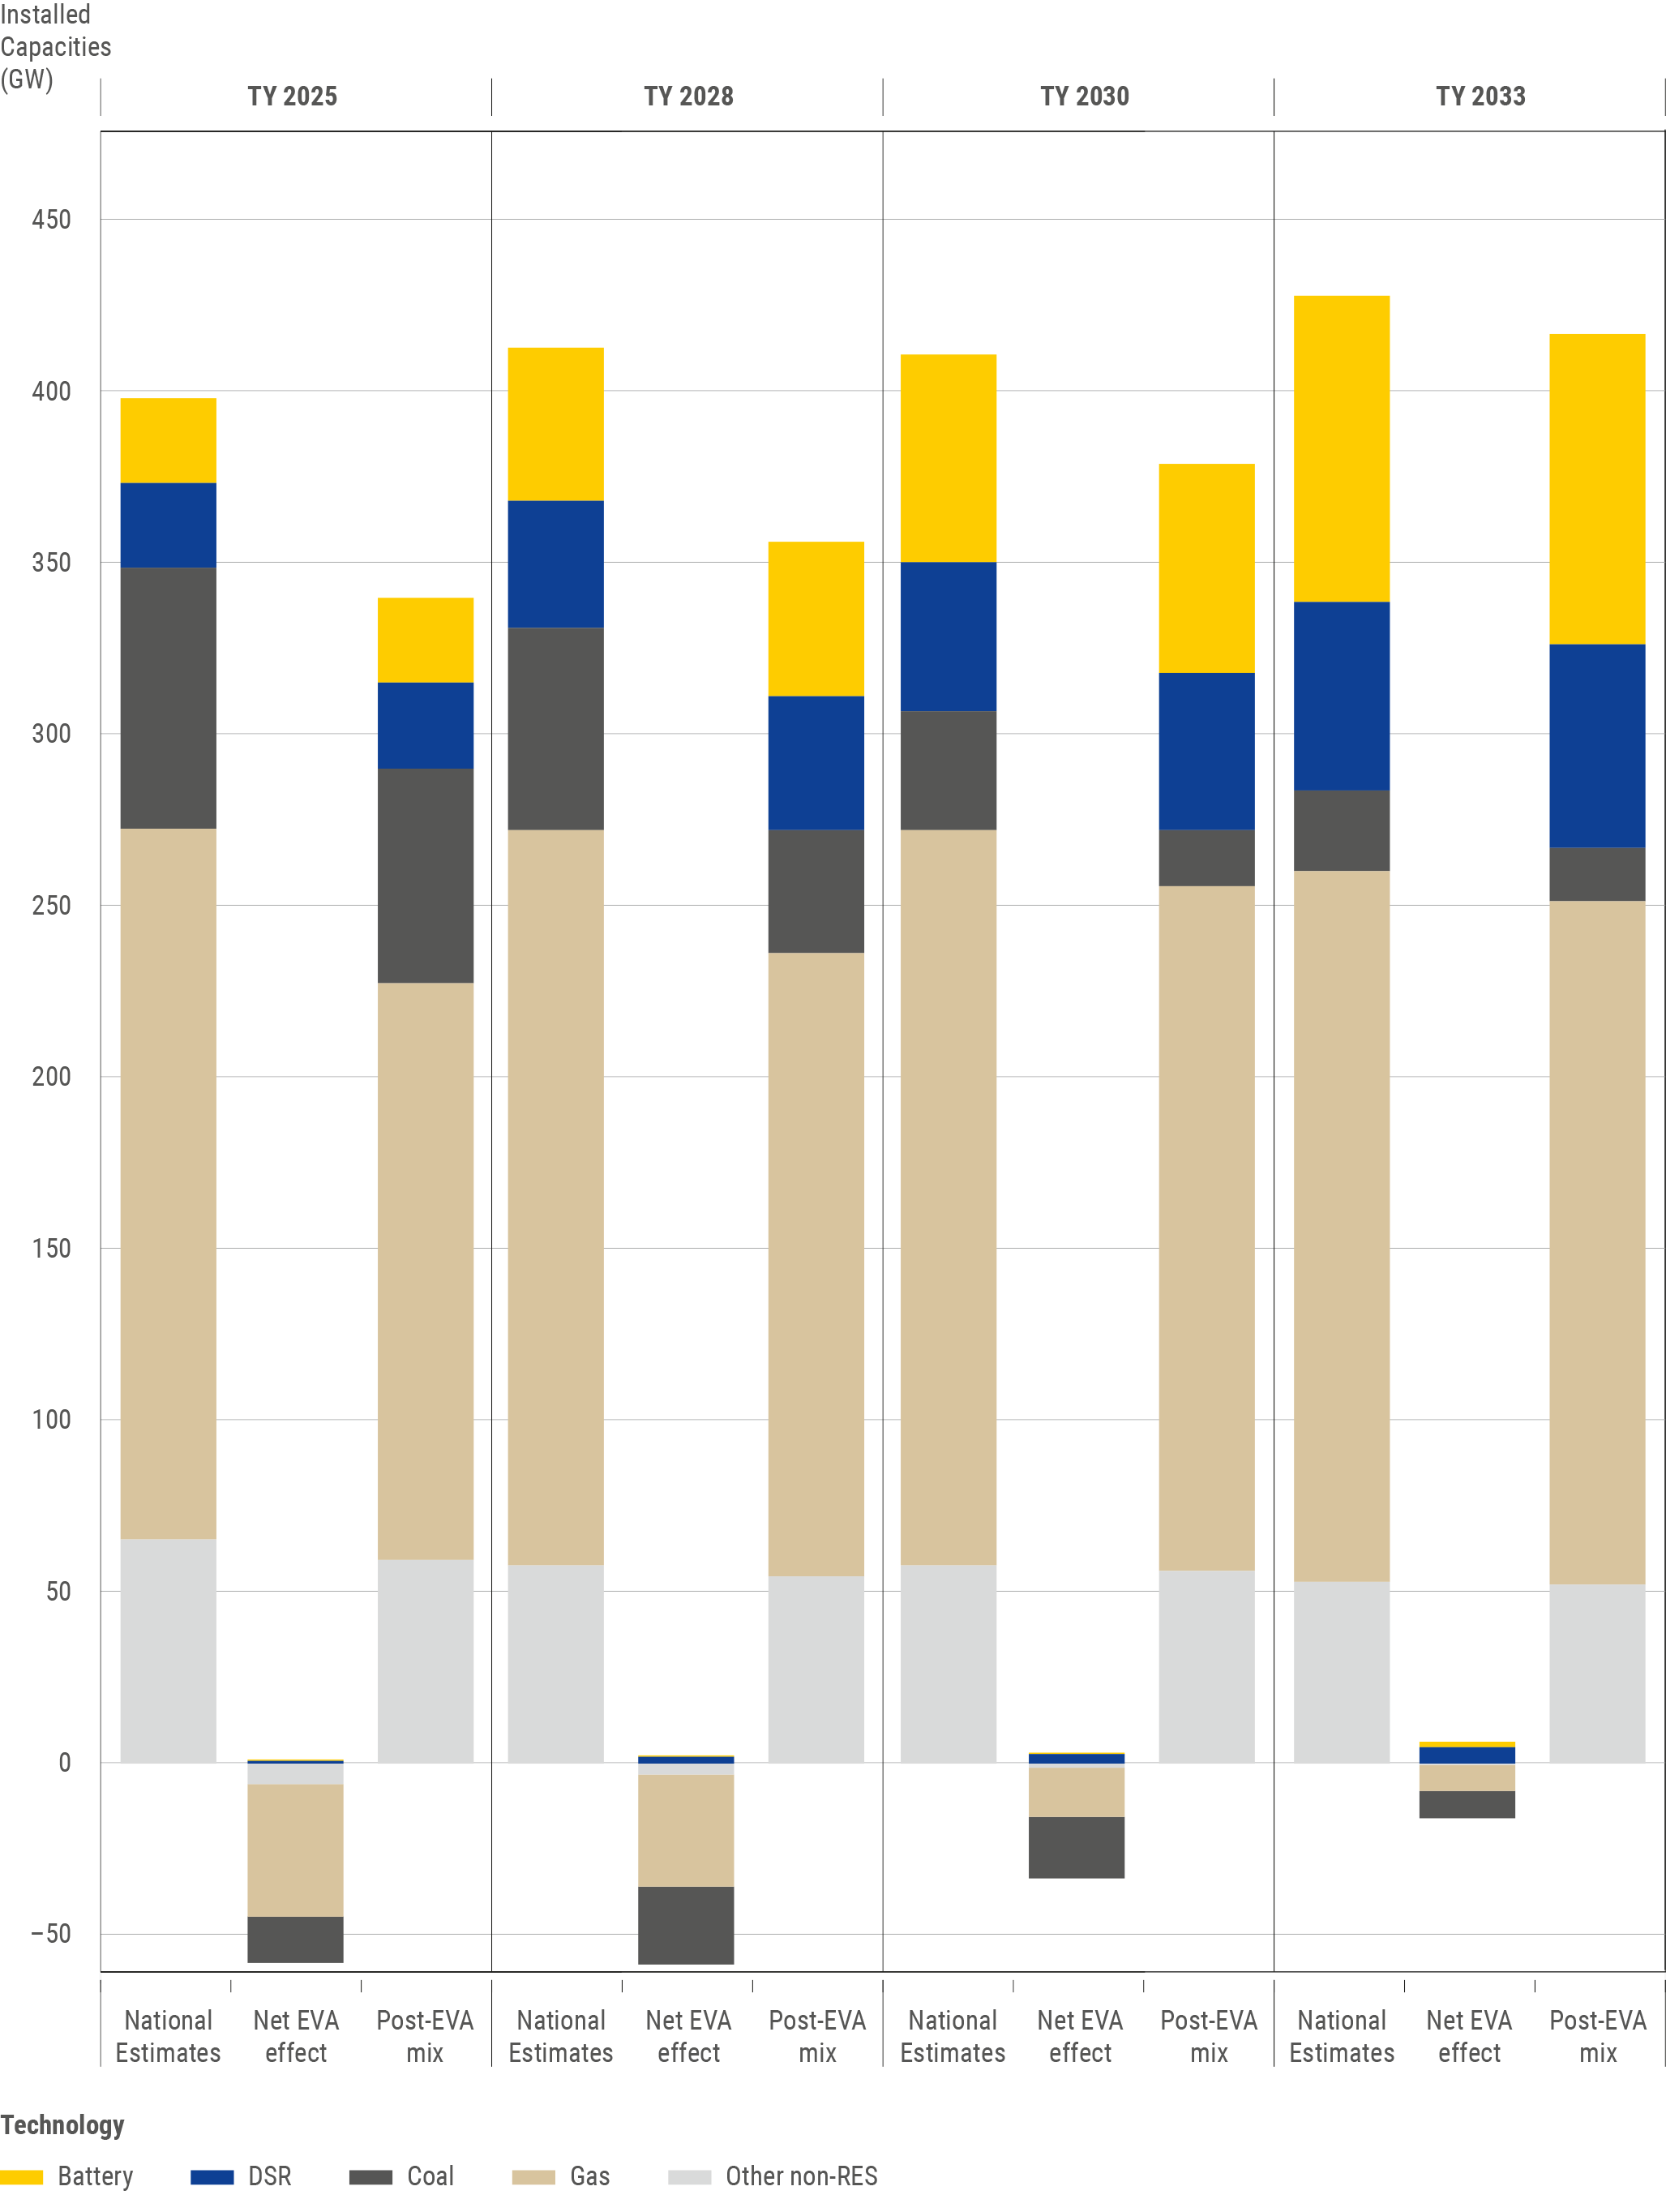
In the short and midterm (Target Years [TYs] 2025 and 2028), the economic viability assessment points to significant capacities at risk of being decommissioned. At the same time, no significant investments are foreseen in such a short timeframe. This decommissioned capacity decreases notably the available margins and leads to adequacy risks in some countries, also in the European continent. It most importantly highlights the criticality of maintaining the pace of integrating new renewable energy sources (RES) capacities as depicted in the input data to the scenarios studied.
In the mid-term, adequacy risks appear in central and north Europe, in addition to island states. Note that adequacy risks reported in the report refer to an average across many climatic years while extreme climatic conditions would lead to major adequacy risks.
In the longer term (i.e. Target Year 2030 and 2033), the economic viability analysis still shows important risks for the assumed thermal generation fleet and simultaneously significant potential new investments (mostly natural gas power plants), triggered by high market prices that occur in some hours. In 2033, significant adequacy risks are observed in many European countries. The countries with the largest amount of capacity at risk are Great Britain, Poland, Italy, Czech Republic, Cyprus, Germany, Luxembourg, Hungary, Denmark, Serbia, France, Belgium.
Despite slightly lower gas prices compared to the ERAA 2022 edition, the merit order between gas and coal put more pressure on gas technologies compared to coal in the short term (2025), and the trend is inverted from 2028, bringing gas before coal in the merit order.
Main findings
Being an inherently complex study, ERAA is characterised by a significant degree of uncertainty and computational constraints. Thus, modelling decisions, assumptions in addition to the probabilistic nature of the assessment must be considered when interpreting the results.
ERAA is still in the implementation phase, and the 2023 edition features considerable improvements over the previous one. In addition, assumption for a same given target year can evolve fast from one edition to another, due to the ongoing accelerating energy transition. As a consequence, successive edition results must be compared with specific care and in view of all the updates and differences between the two products; these include updates and changes in the assumptions and scenarios, but also modelling improvements with significant impact on the adequacy results.
Economic Viability Assessment
The EVA step assesses the viability of capacity resources1 participating in the energy-only market, and it is applicable to both scenarios. The EVA is a risk assessment of what could happen; it is not a prediction of what will happen. Units with an awarded capacity mechanism (CM) contract are excluded from the EVA for the duration of their contracts and the viability of resource capacities participating in the energy-only market are assessed using a long-term planning model with the objective of minimising the total system costs2. The key decision variables of that long-term model aim to identify the economic-optimal (least-cost) evolution of resource capacity over the modelled horizon. This assessment therefore delivers insight, per each bidding zone and over the TYs, on the resource capacities that are likely to be (i) decommissioned, (ii) invested in, (iii) (de)mothballed or (iv) extended in lifetime. More details on the assumptions behind the EVA can be found in Annex 1, while the detailed methodology is found in Annex 2.
- 1Capacity resources include storage units (i.e. grid-scale batteries).
- 2Article 6.2 of the ERAA methodology acknowledges the use of overall system cost minimisation for the EVA, albeit as a simplification and assuming perfect competition.
Two complementary scenarios derived from the same input data have been addressed in the ERAA 2023:
Scenario A (central reference): the climate year representation in the economic viability analysis is calibrated based on the Loss of Load Expectation (LOLE) of the ERAA 2022 adequacy results aiming at the consistency of this indicator throughout the economic viability and adequacy analyses. This scenario aims at exposing investors to a similar amount of price spikes in both modules of ERAA.
Scenario B (sensitivity): the climate year representation in the economic viability analysis is calculated according to the ERAA 2022 methodology, aiming at the consistency of the total system costs throughout the Economic Viability Assessment. This scenario exposes investors to a lower amount of price spikes in the Economic Viability Assessment than in the Economic Dispatch module .
Both central reference scenario and sensitivity provide relevant information. The sensitivity complements the central reference scenario. In particular, it illustrates the extent to which the adequacy assessment is sensitive to the weights assigned to the climate years. For more information on the scenario selection methodology see Annex 2.
Adequacy
Scenario A (Central Reference)
The results of the EVA have, naturally, a significant impact on the adequacy assessment. Adequacy risks appear all few European countries in Scenario A and the margins are tight. The scarcity risks tend to shift from the peripheral areas of Europe in 2025 to the central parts of the continent by 2033, as observed in the following figures.
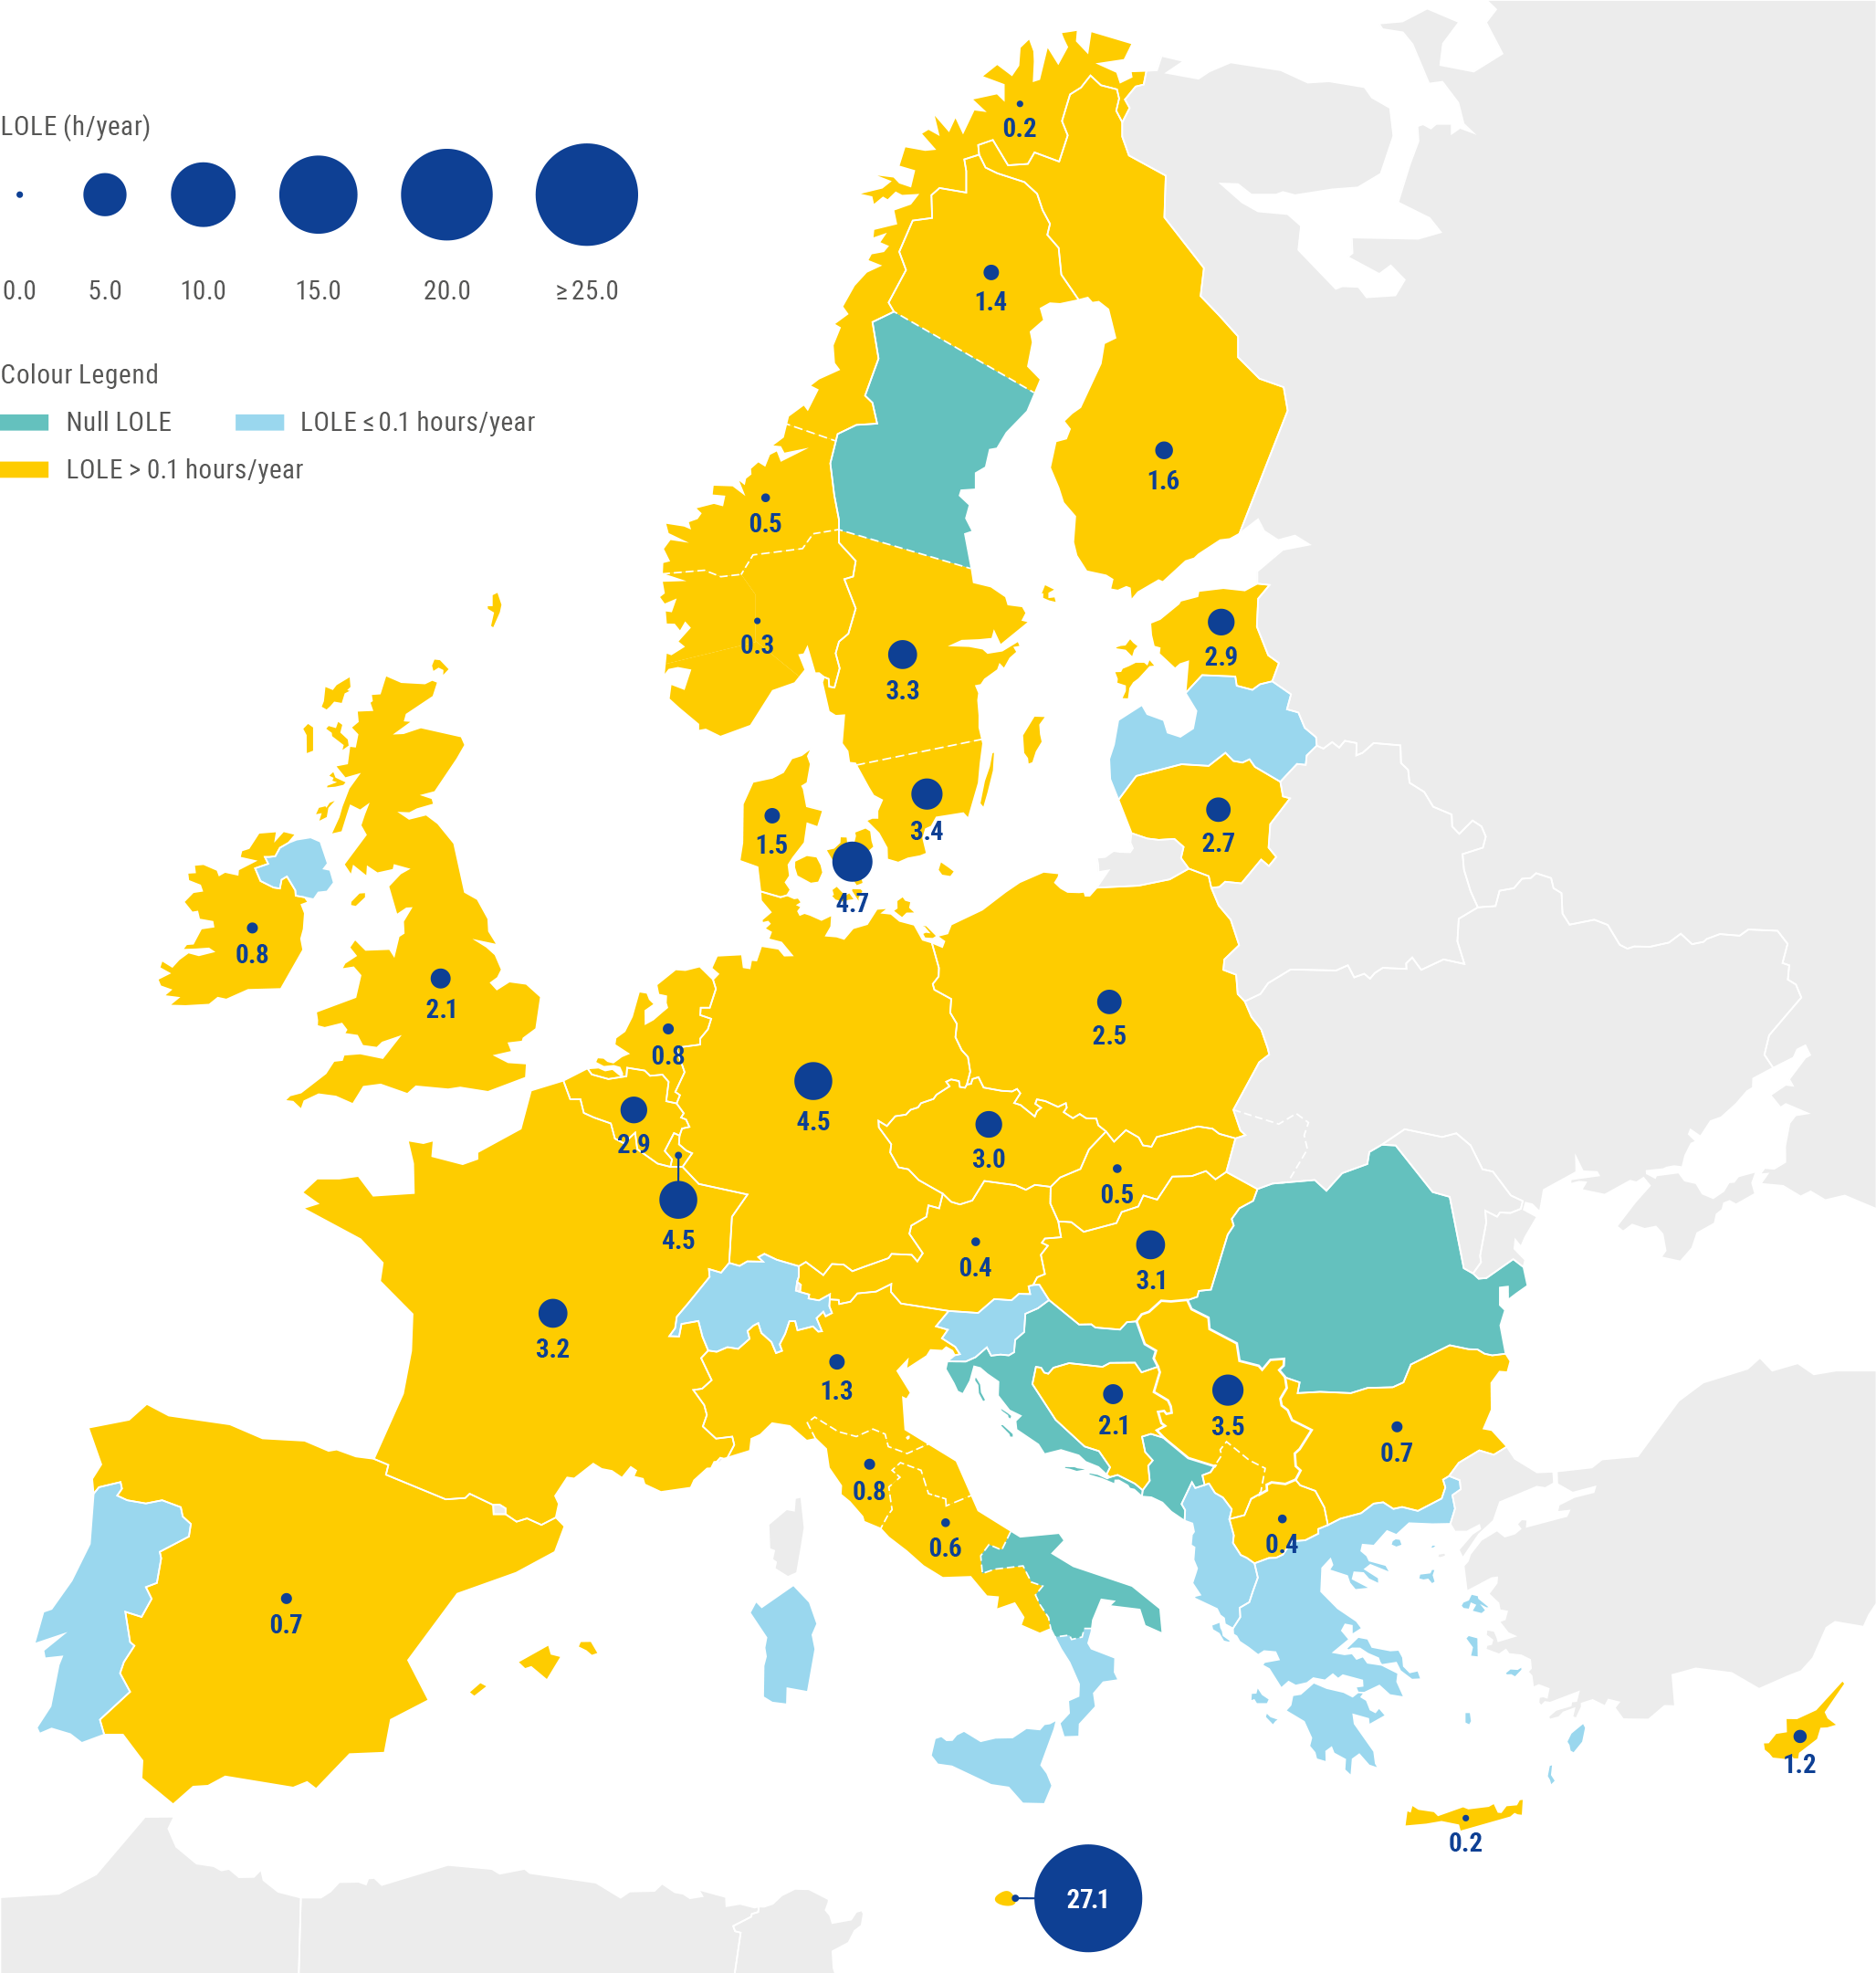
he LOLE values are represented by circles, with larger radius for larger LOLE values. A region’s LOLE is calculated by averaging the Loss of Load Duration (LLD), i.e. hours with unserved energy, resulting from all the simulated Monte Carlo Years using the reference tool.

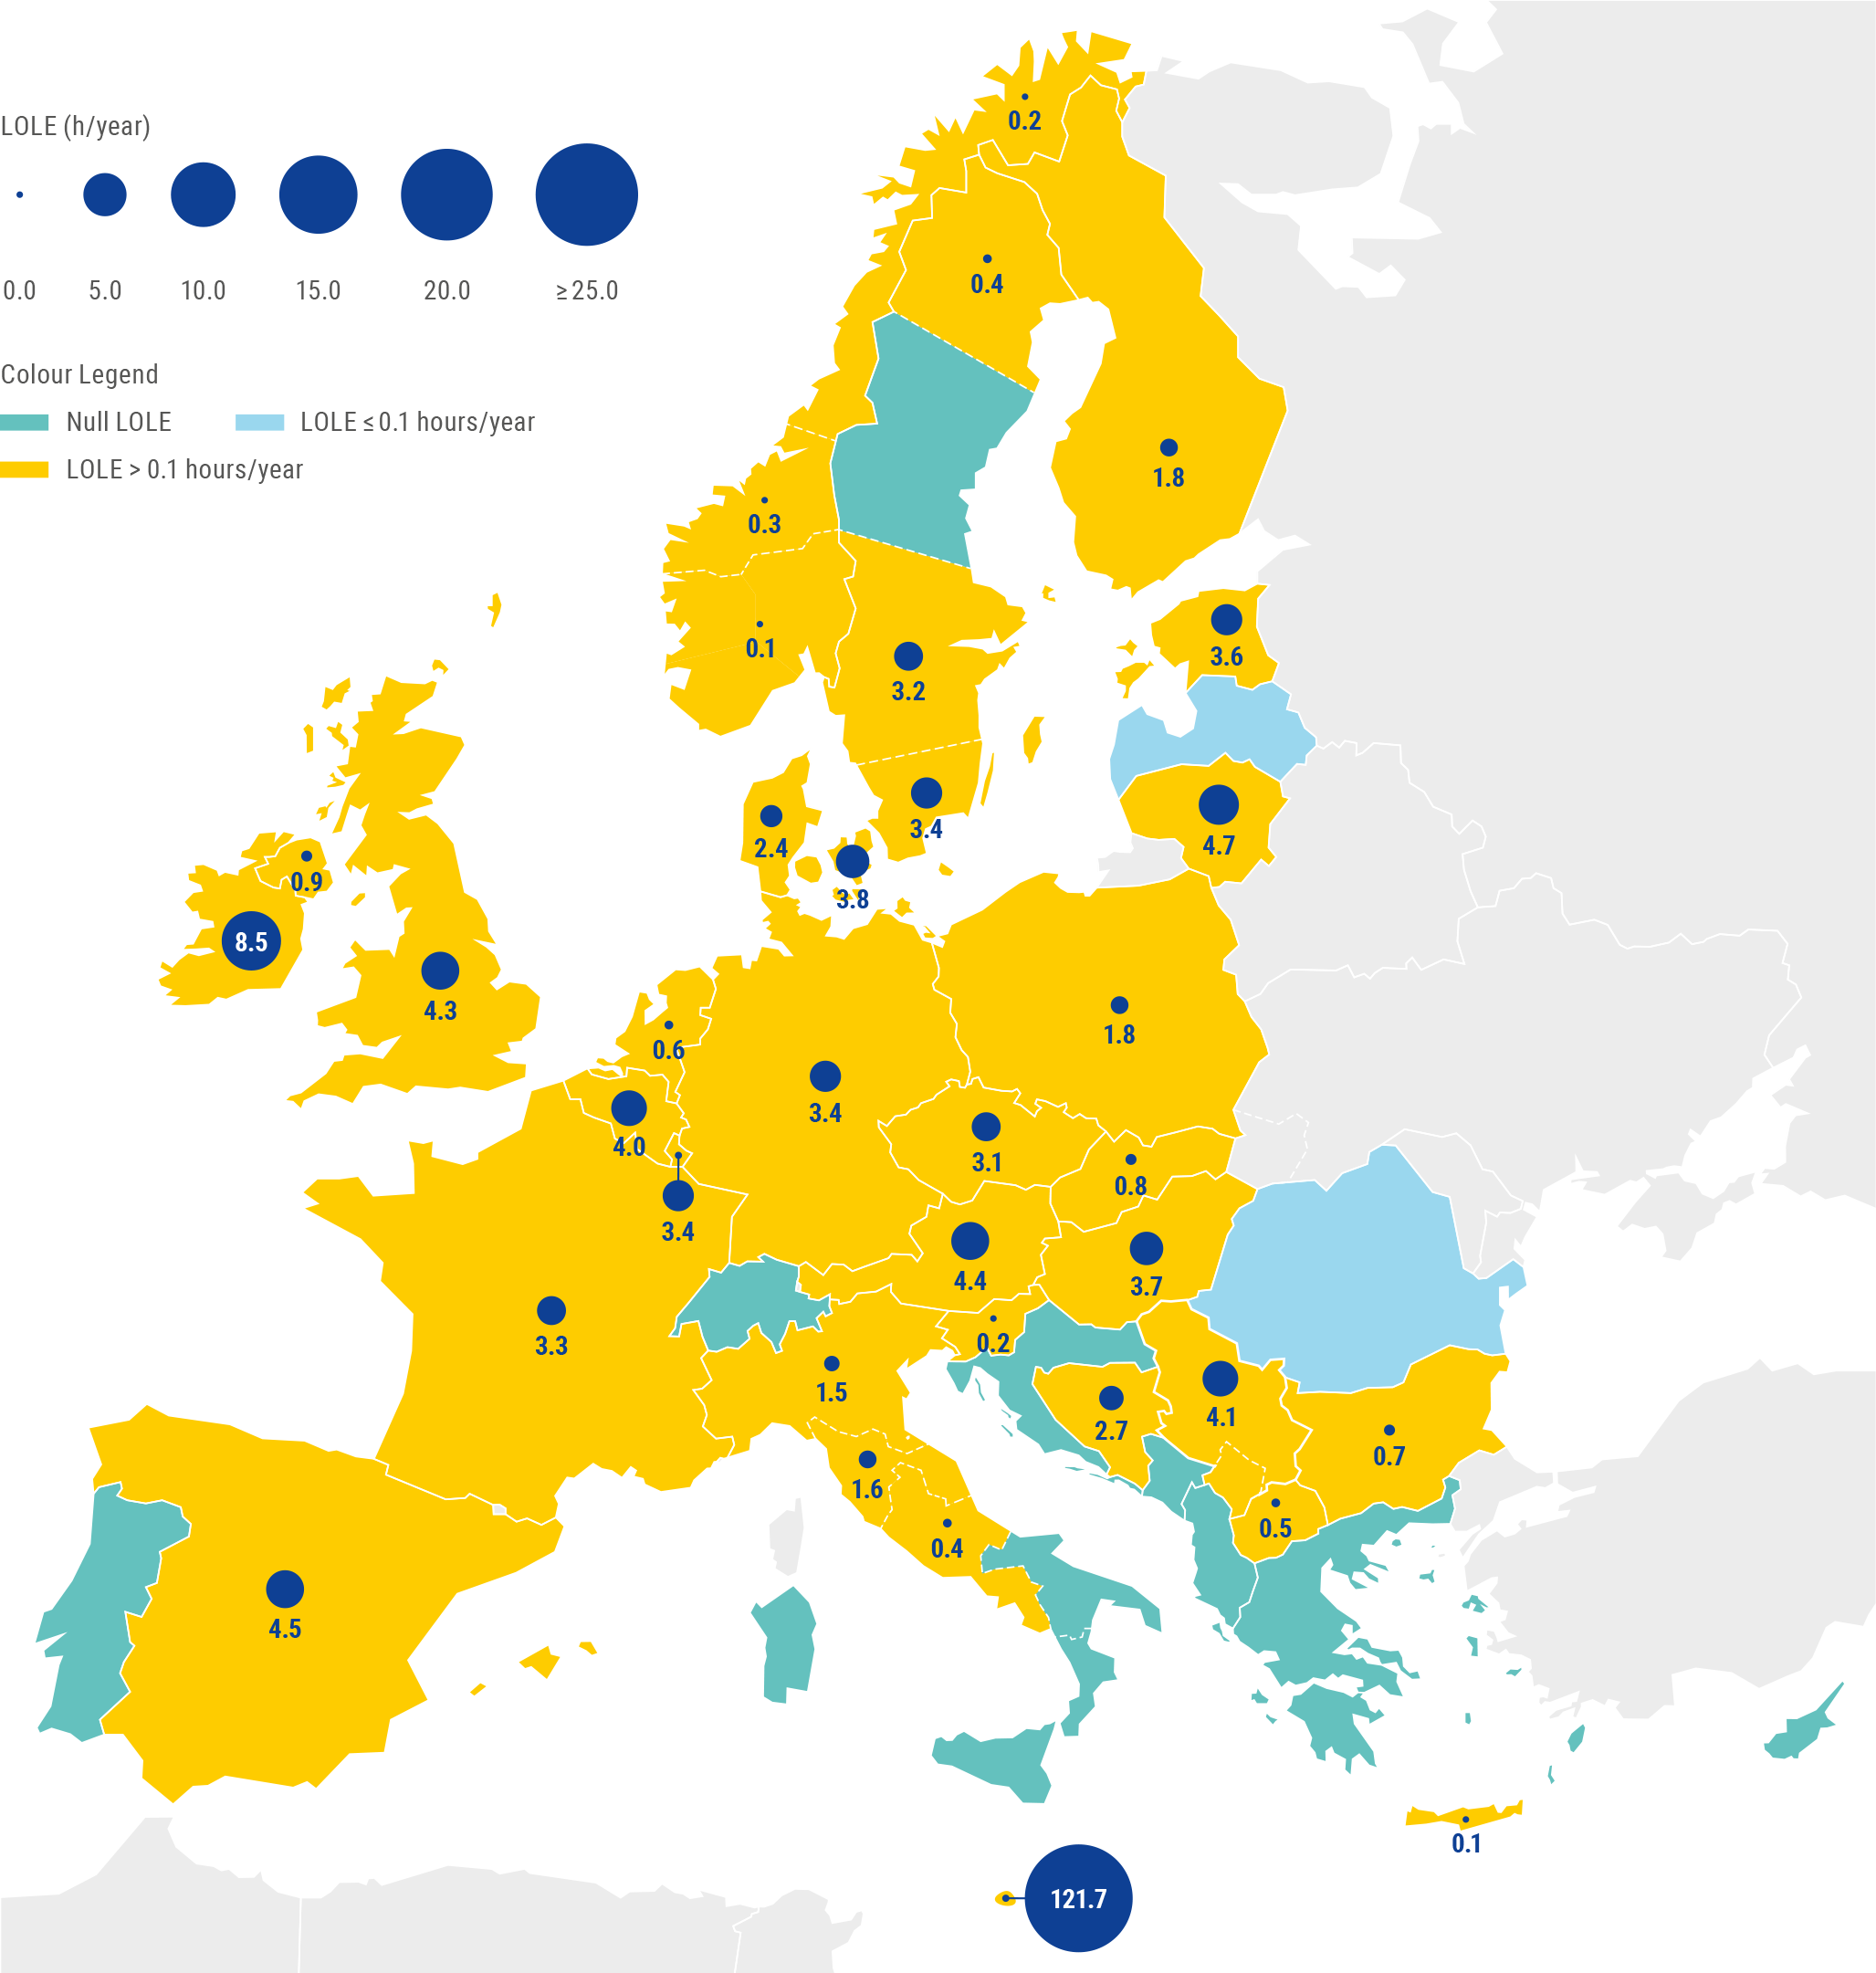
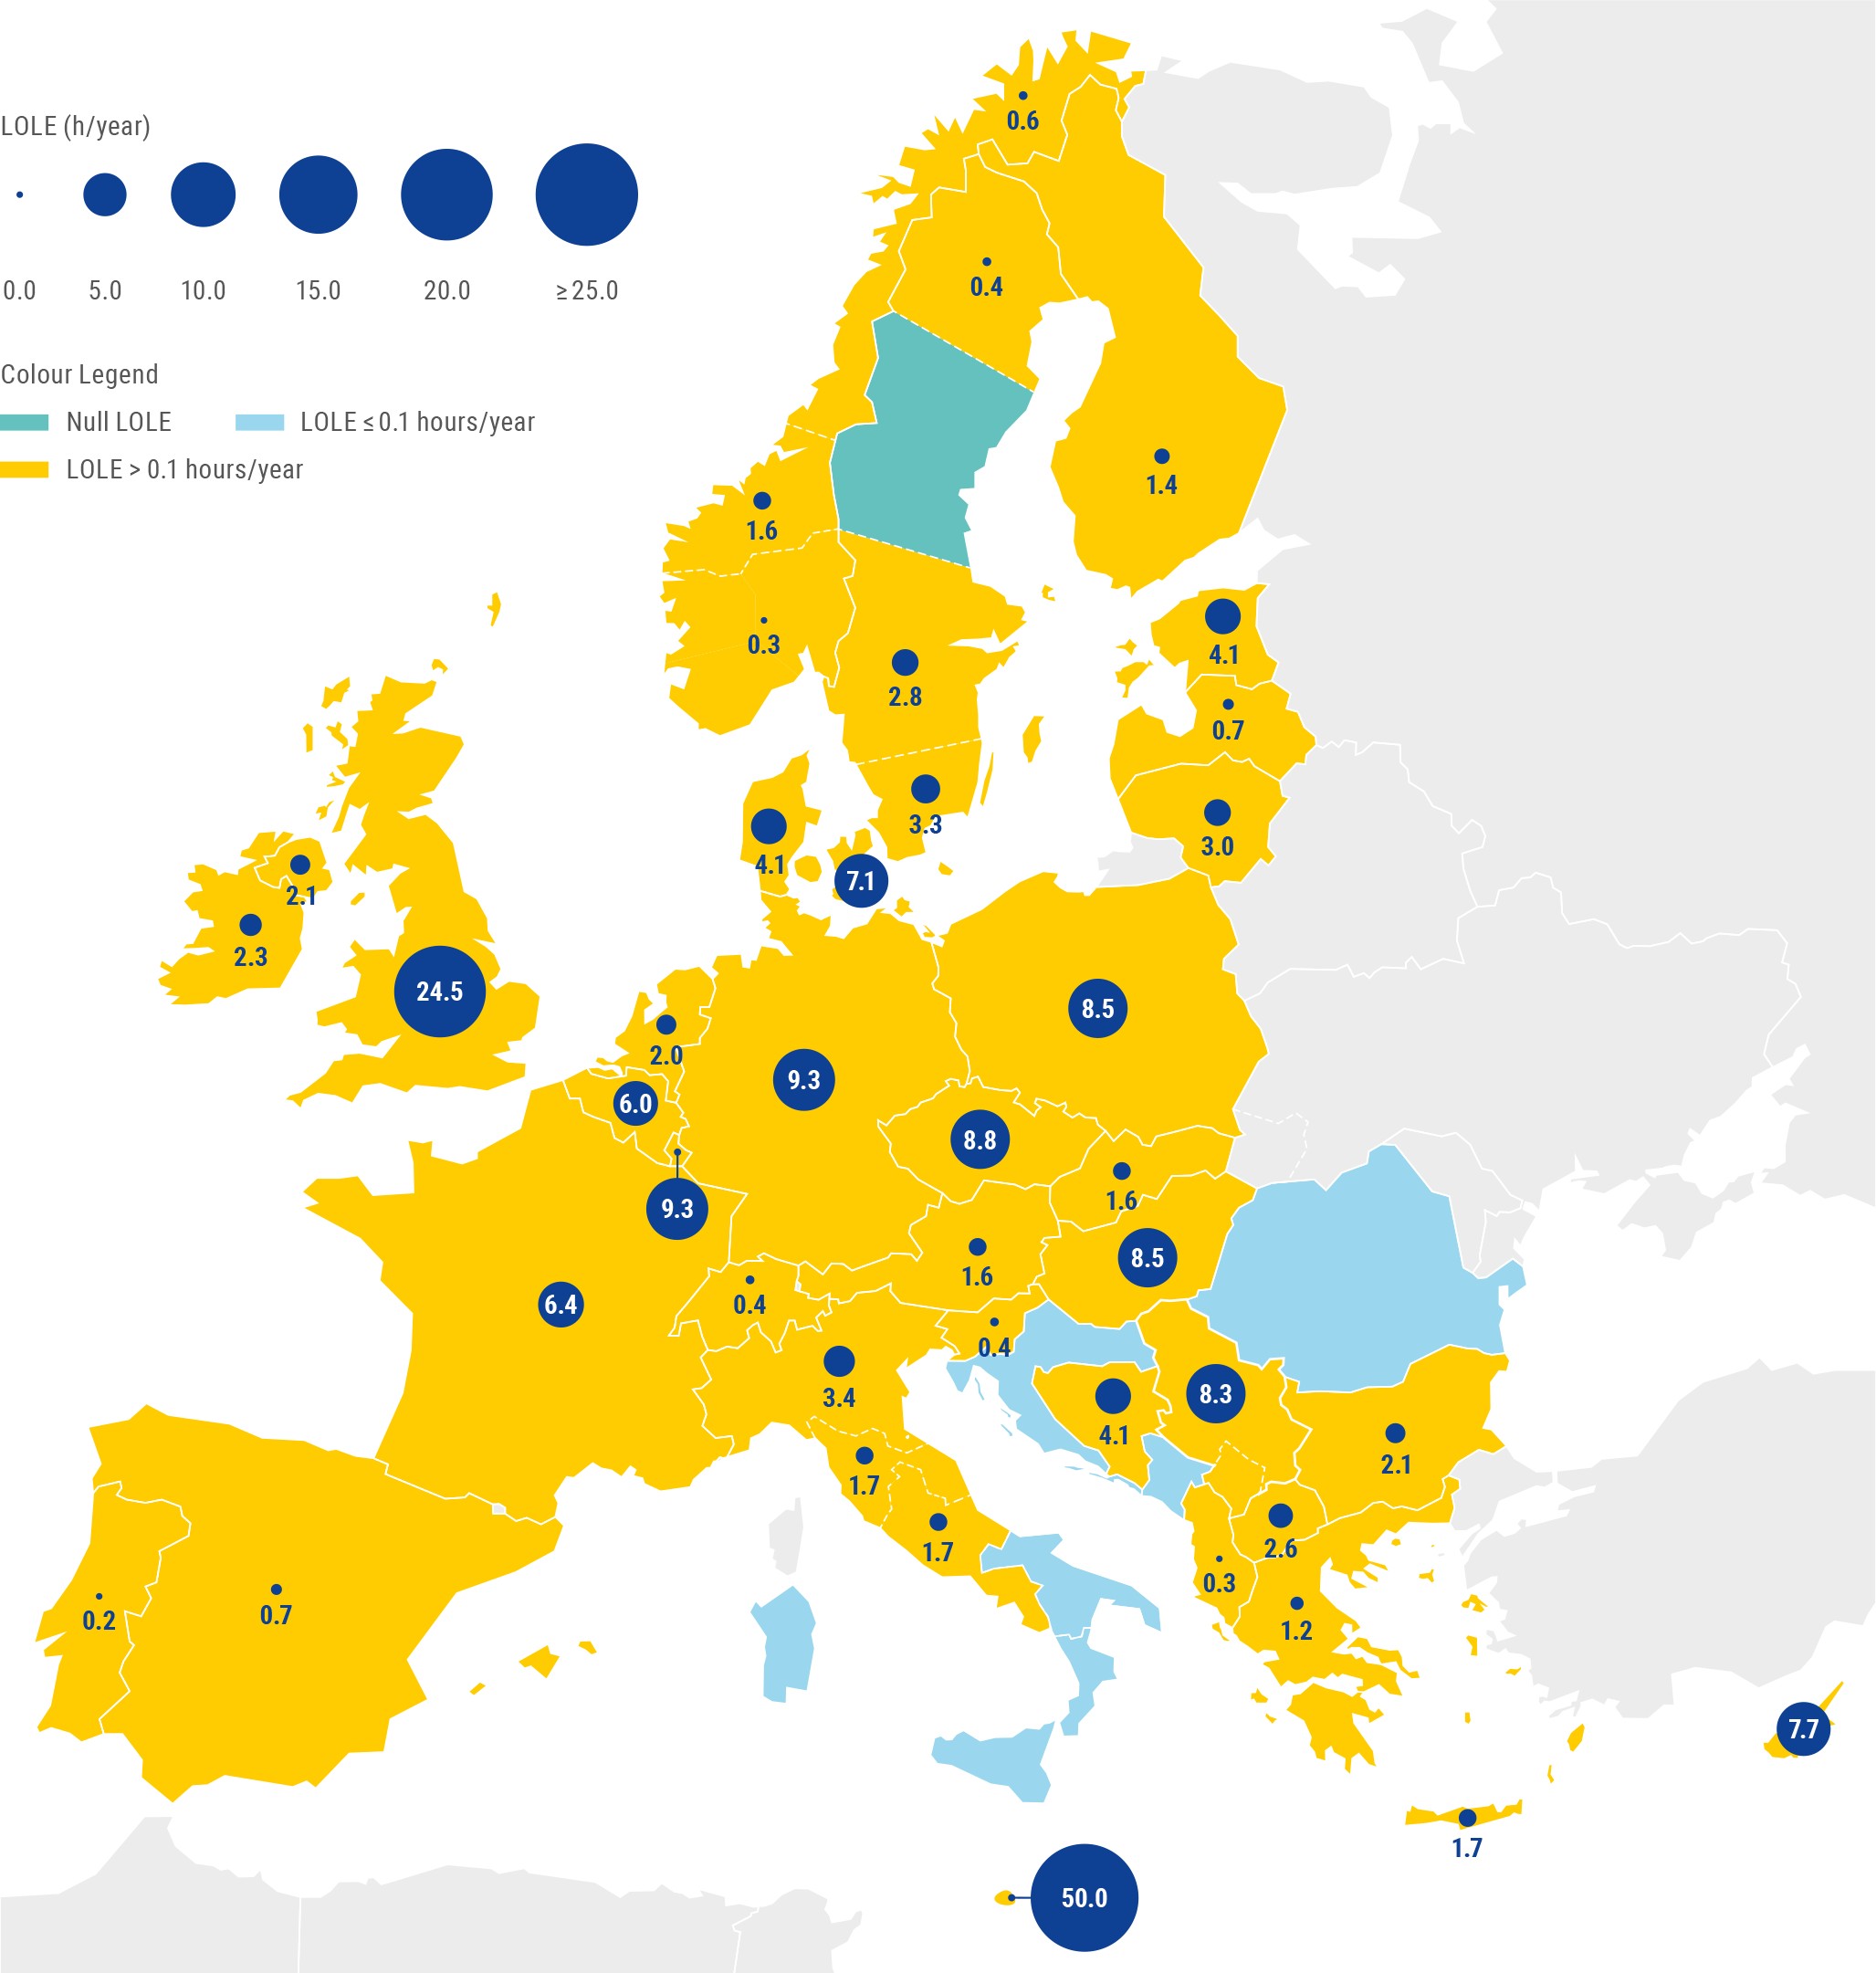
- *Both scenarios account for capacity mechanisms that already hold a capacity mechanism contract granted in any previous auction of any existing or approved capacity mechanism at the time of the assessment, including Demand-Side Response (DSR), which is relevant for Poland in target year 2025. In Malta, an additional 215 MW of non-market resource in the form of emergency gasoil-fired back-up plants are available for dispatch at any time and would largely mitigate the risk of scarcity.
Scenario B (Sensitivity)
EVA indicates risk of higher economic decommissioning in scenario B, which has an impact on the adequacy results. Adequacy risks are higher across Europe in this scenario and increase as we move from the short to mid-term. In 2033, LOLE increases significantly in all the geographical perimeter, but mostly in the central and north of Europe.
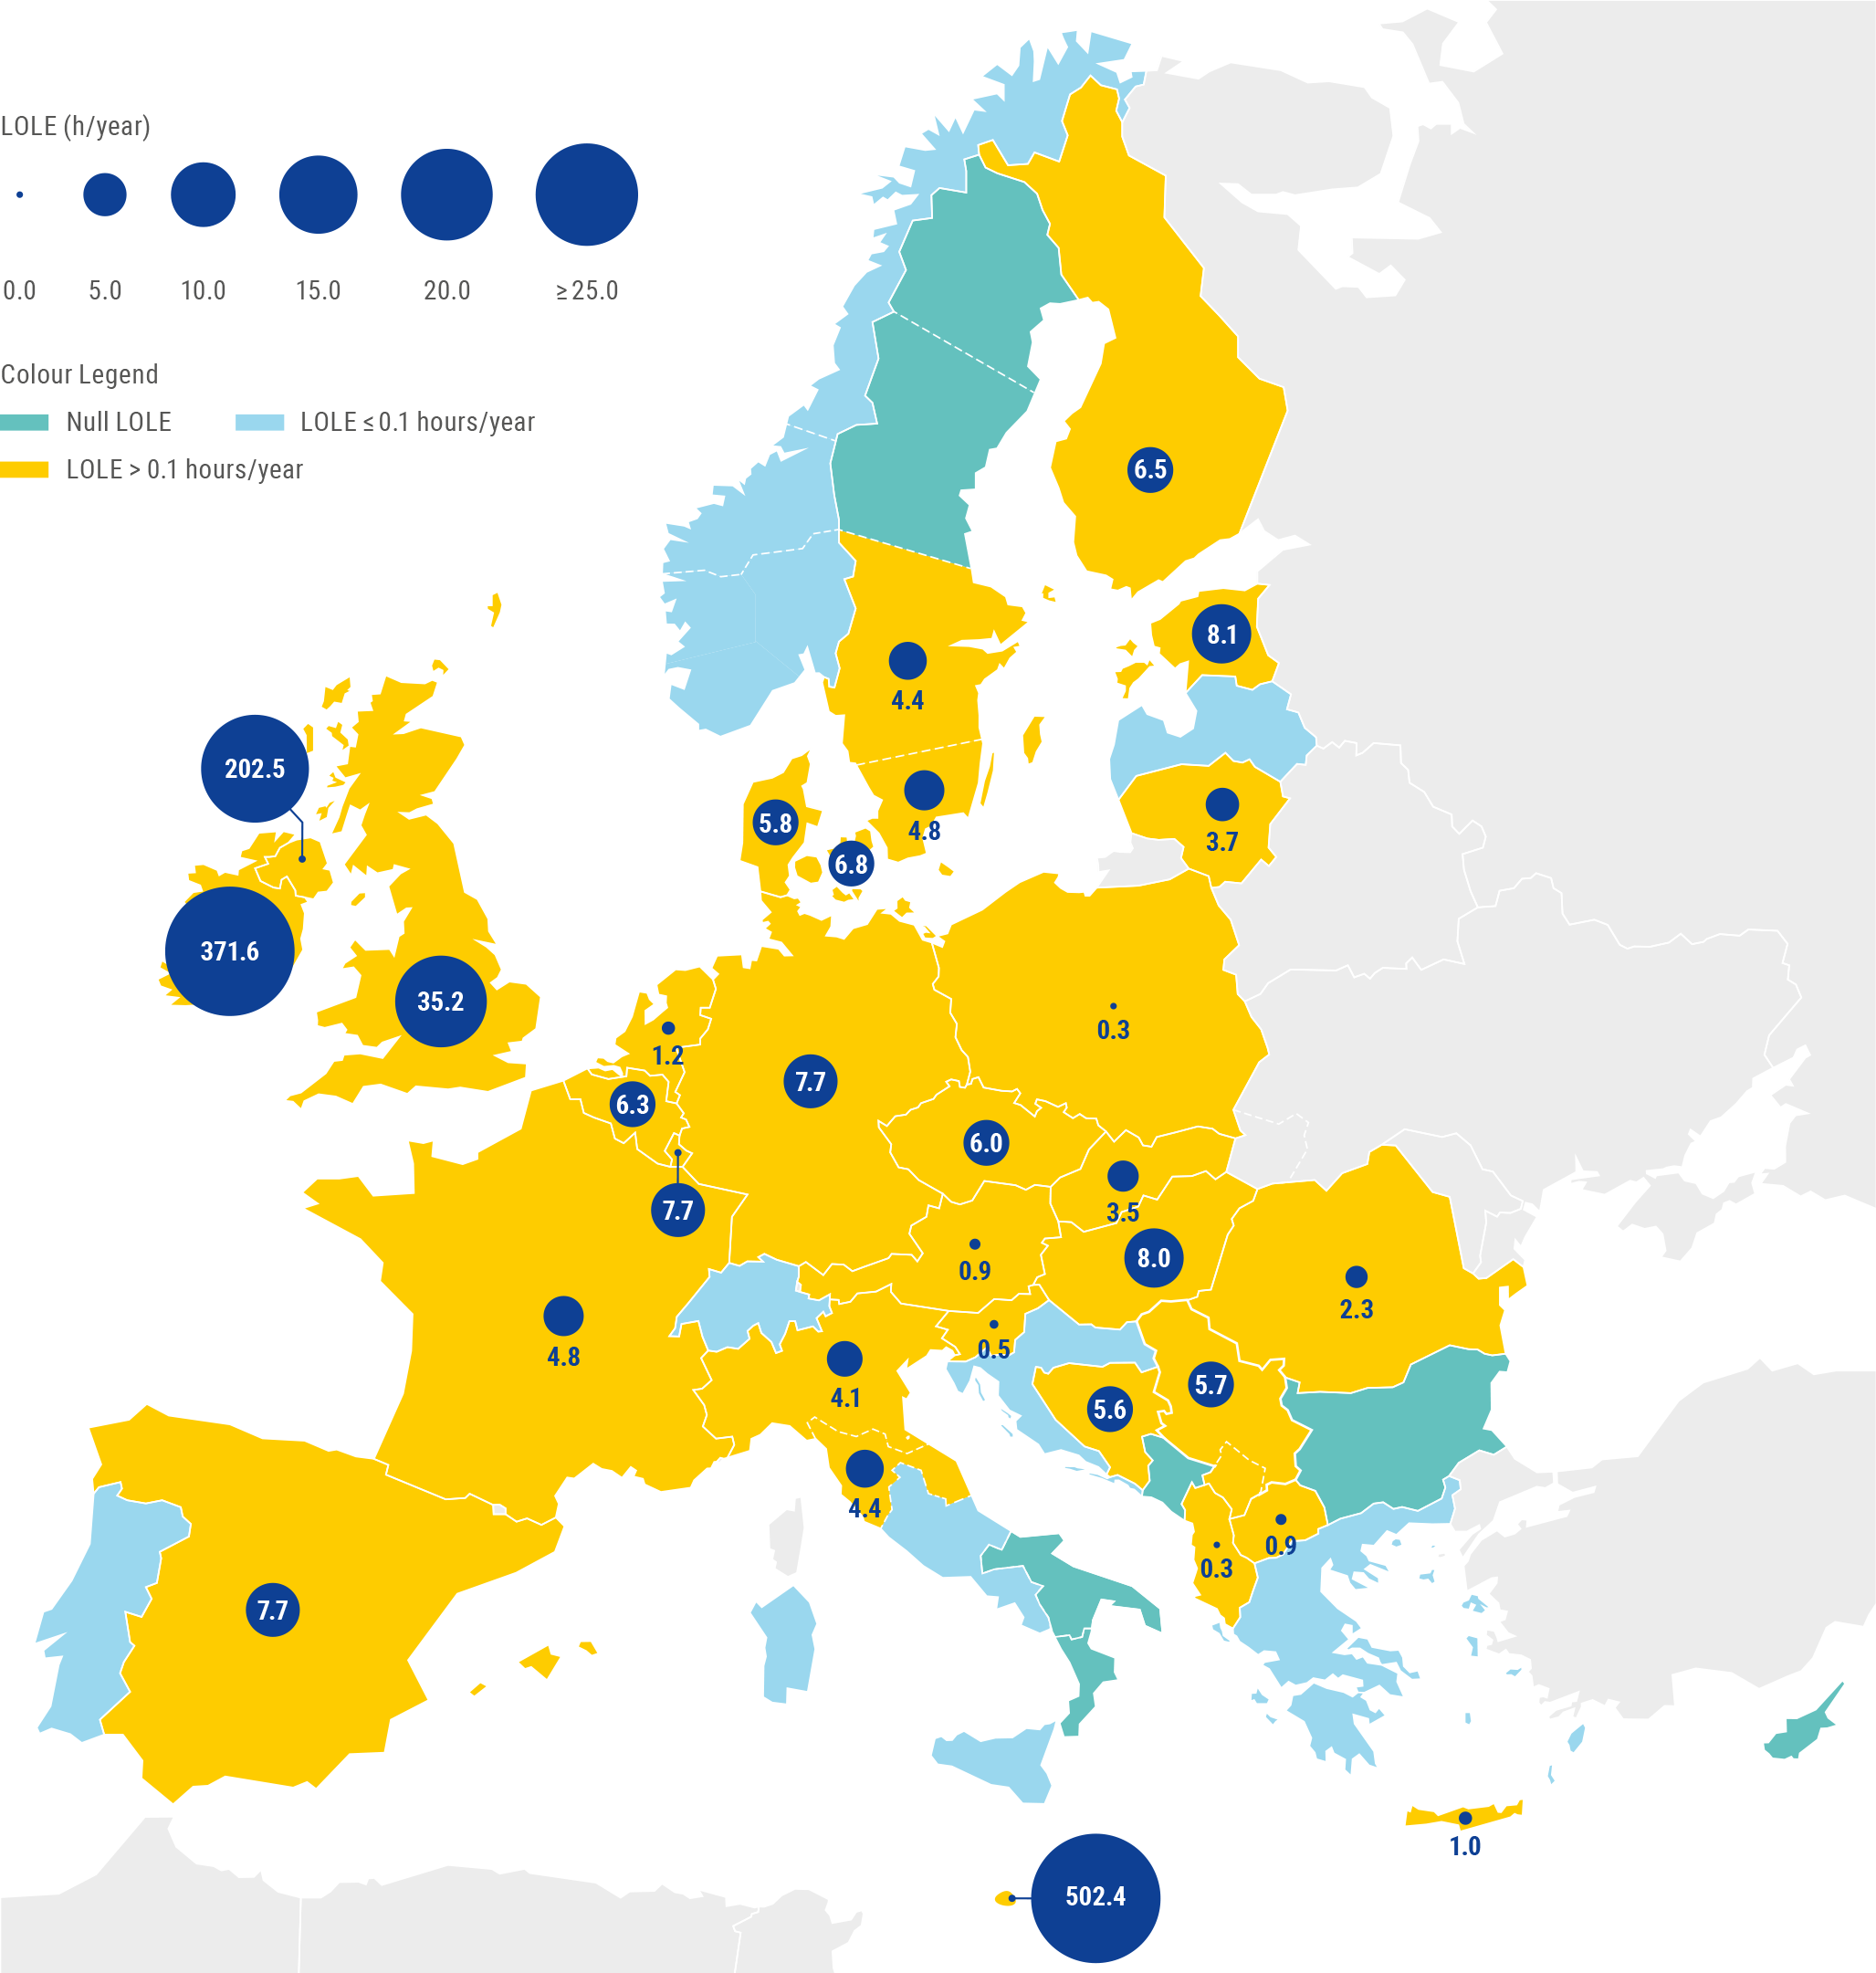
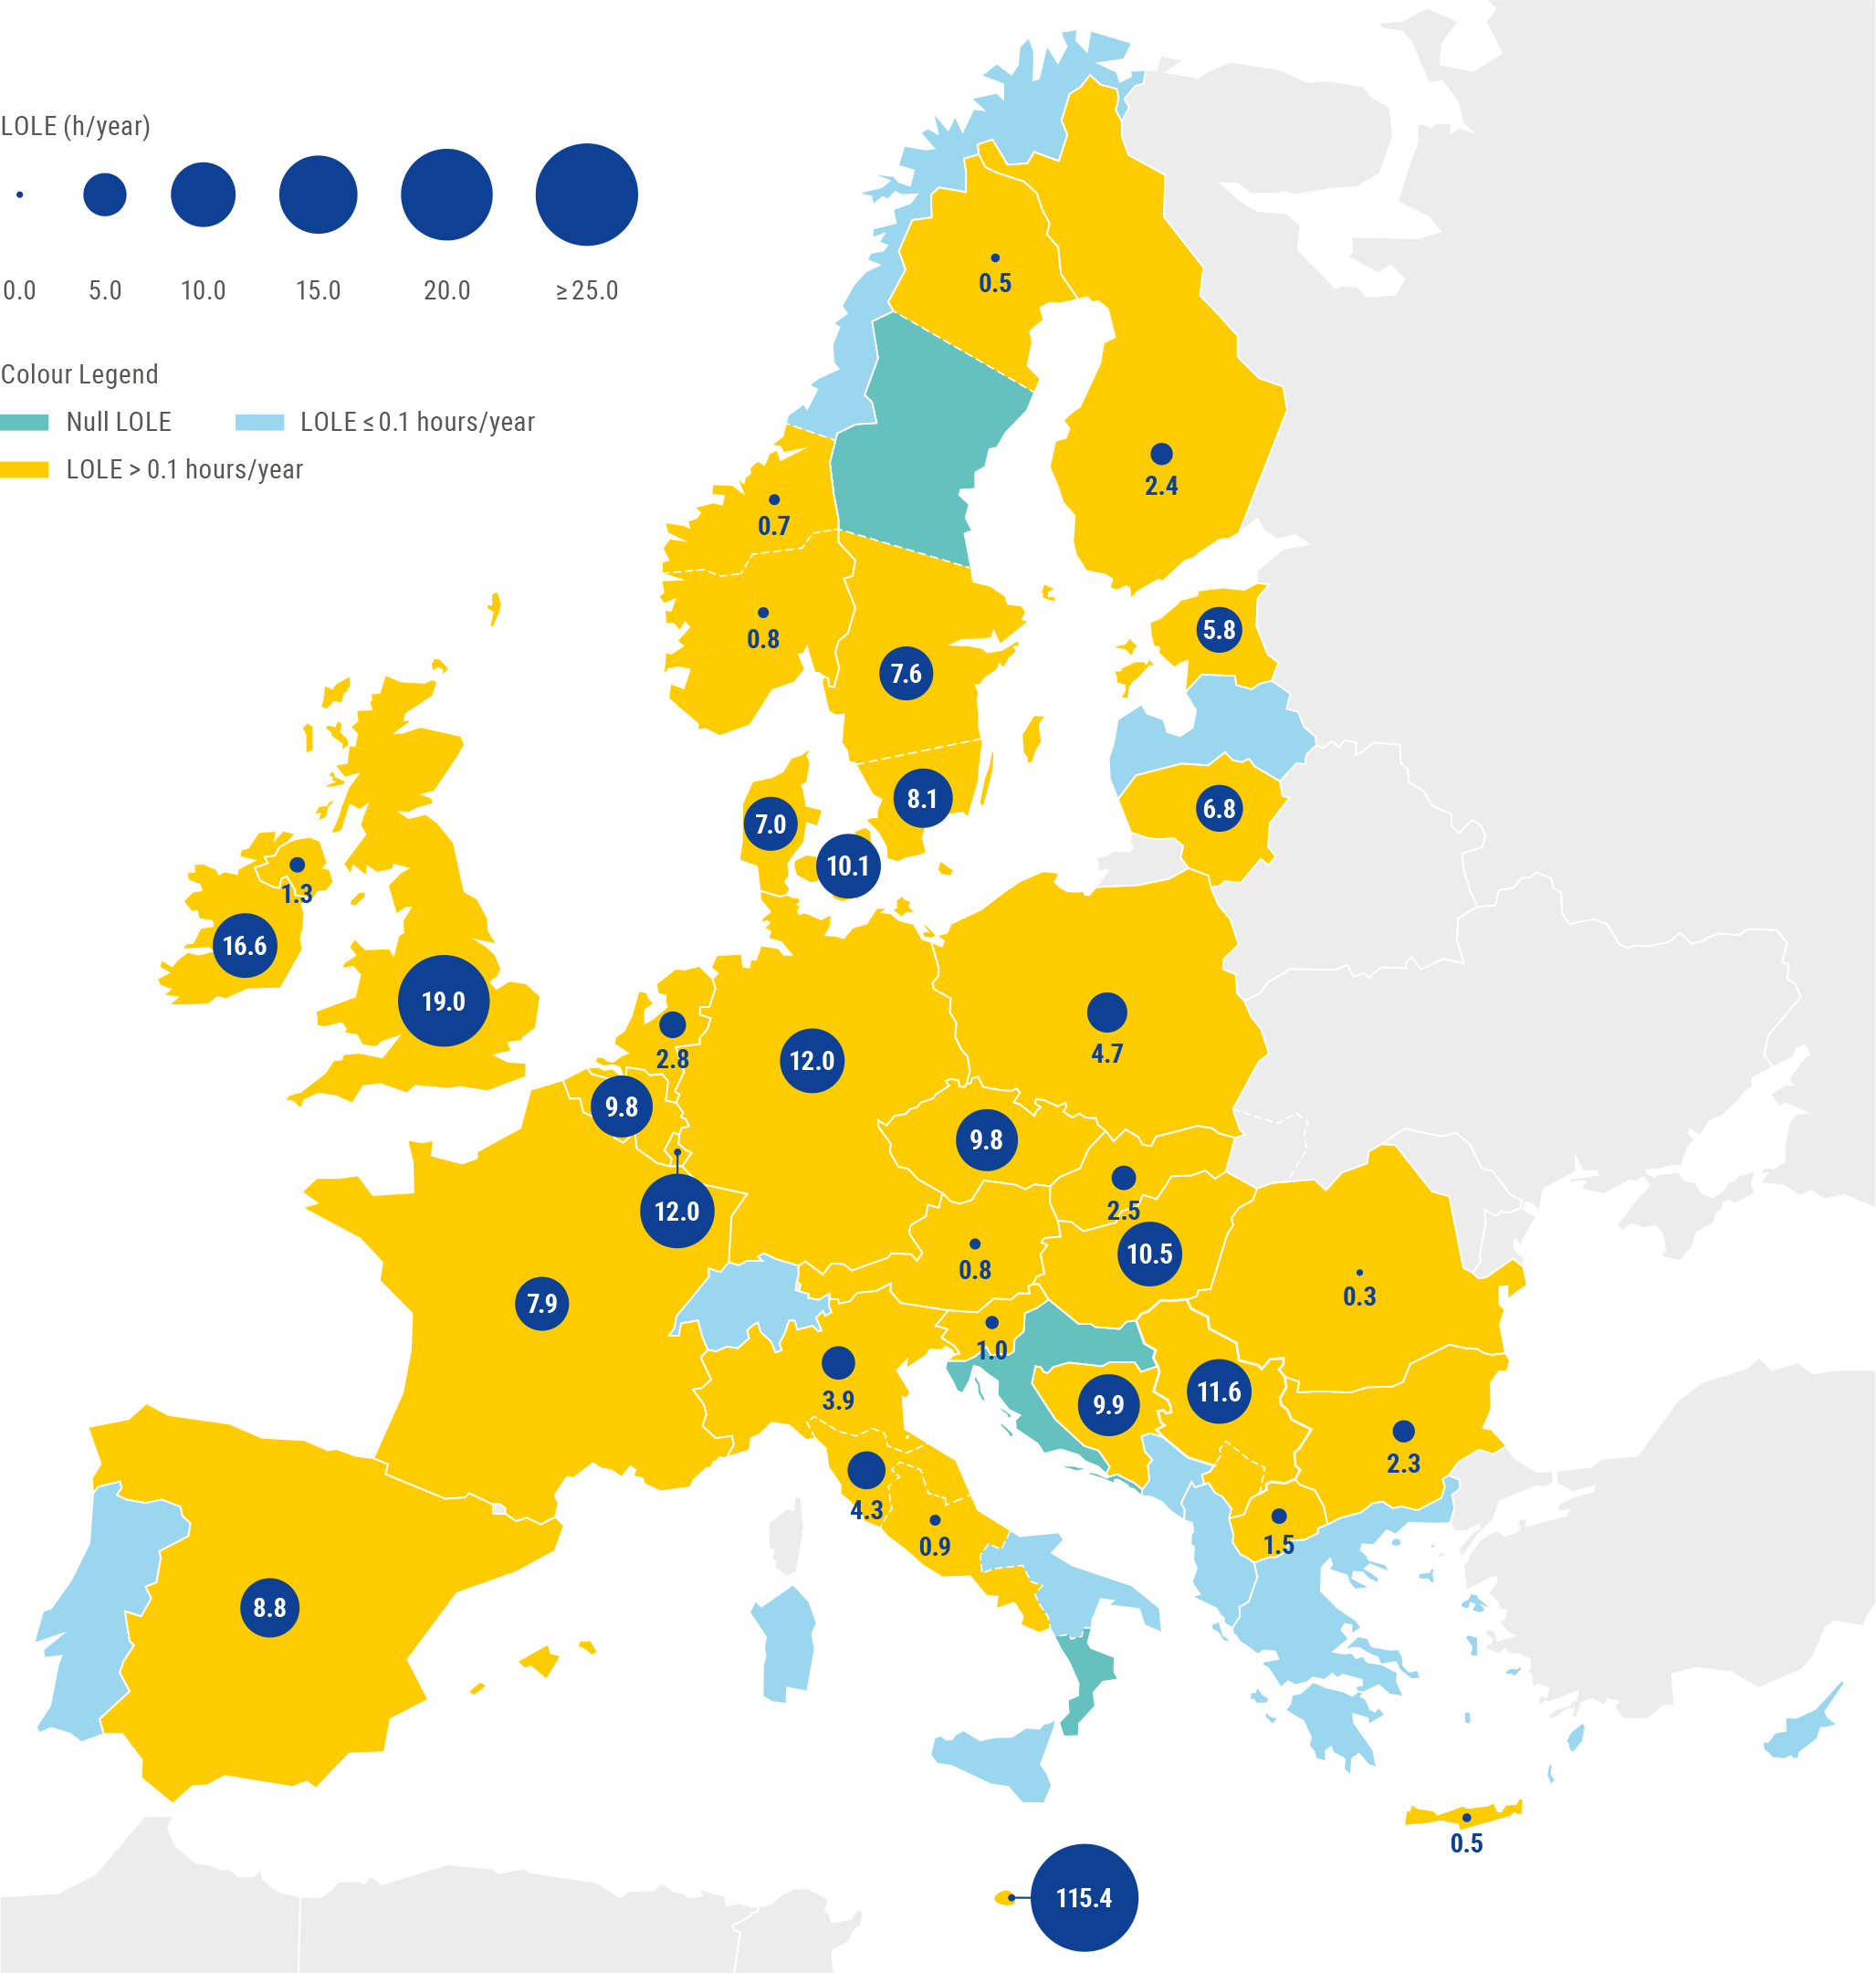
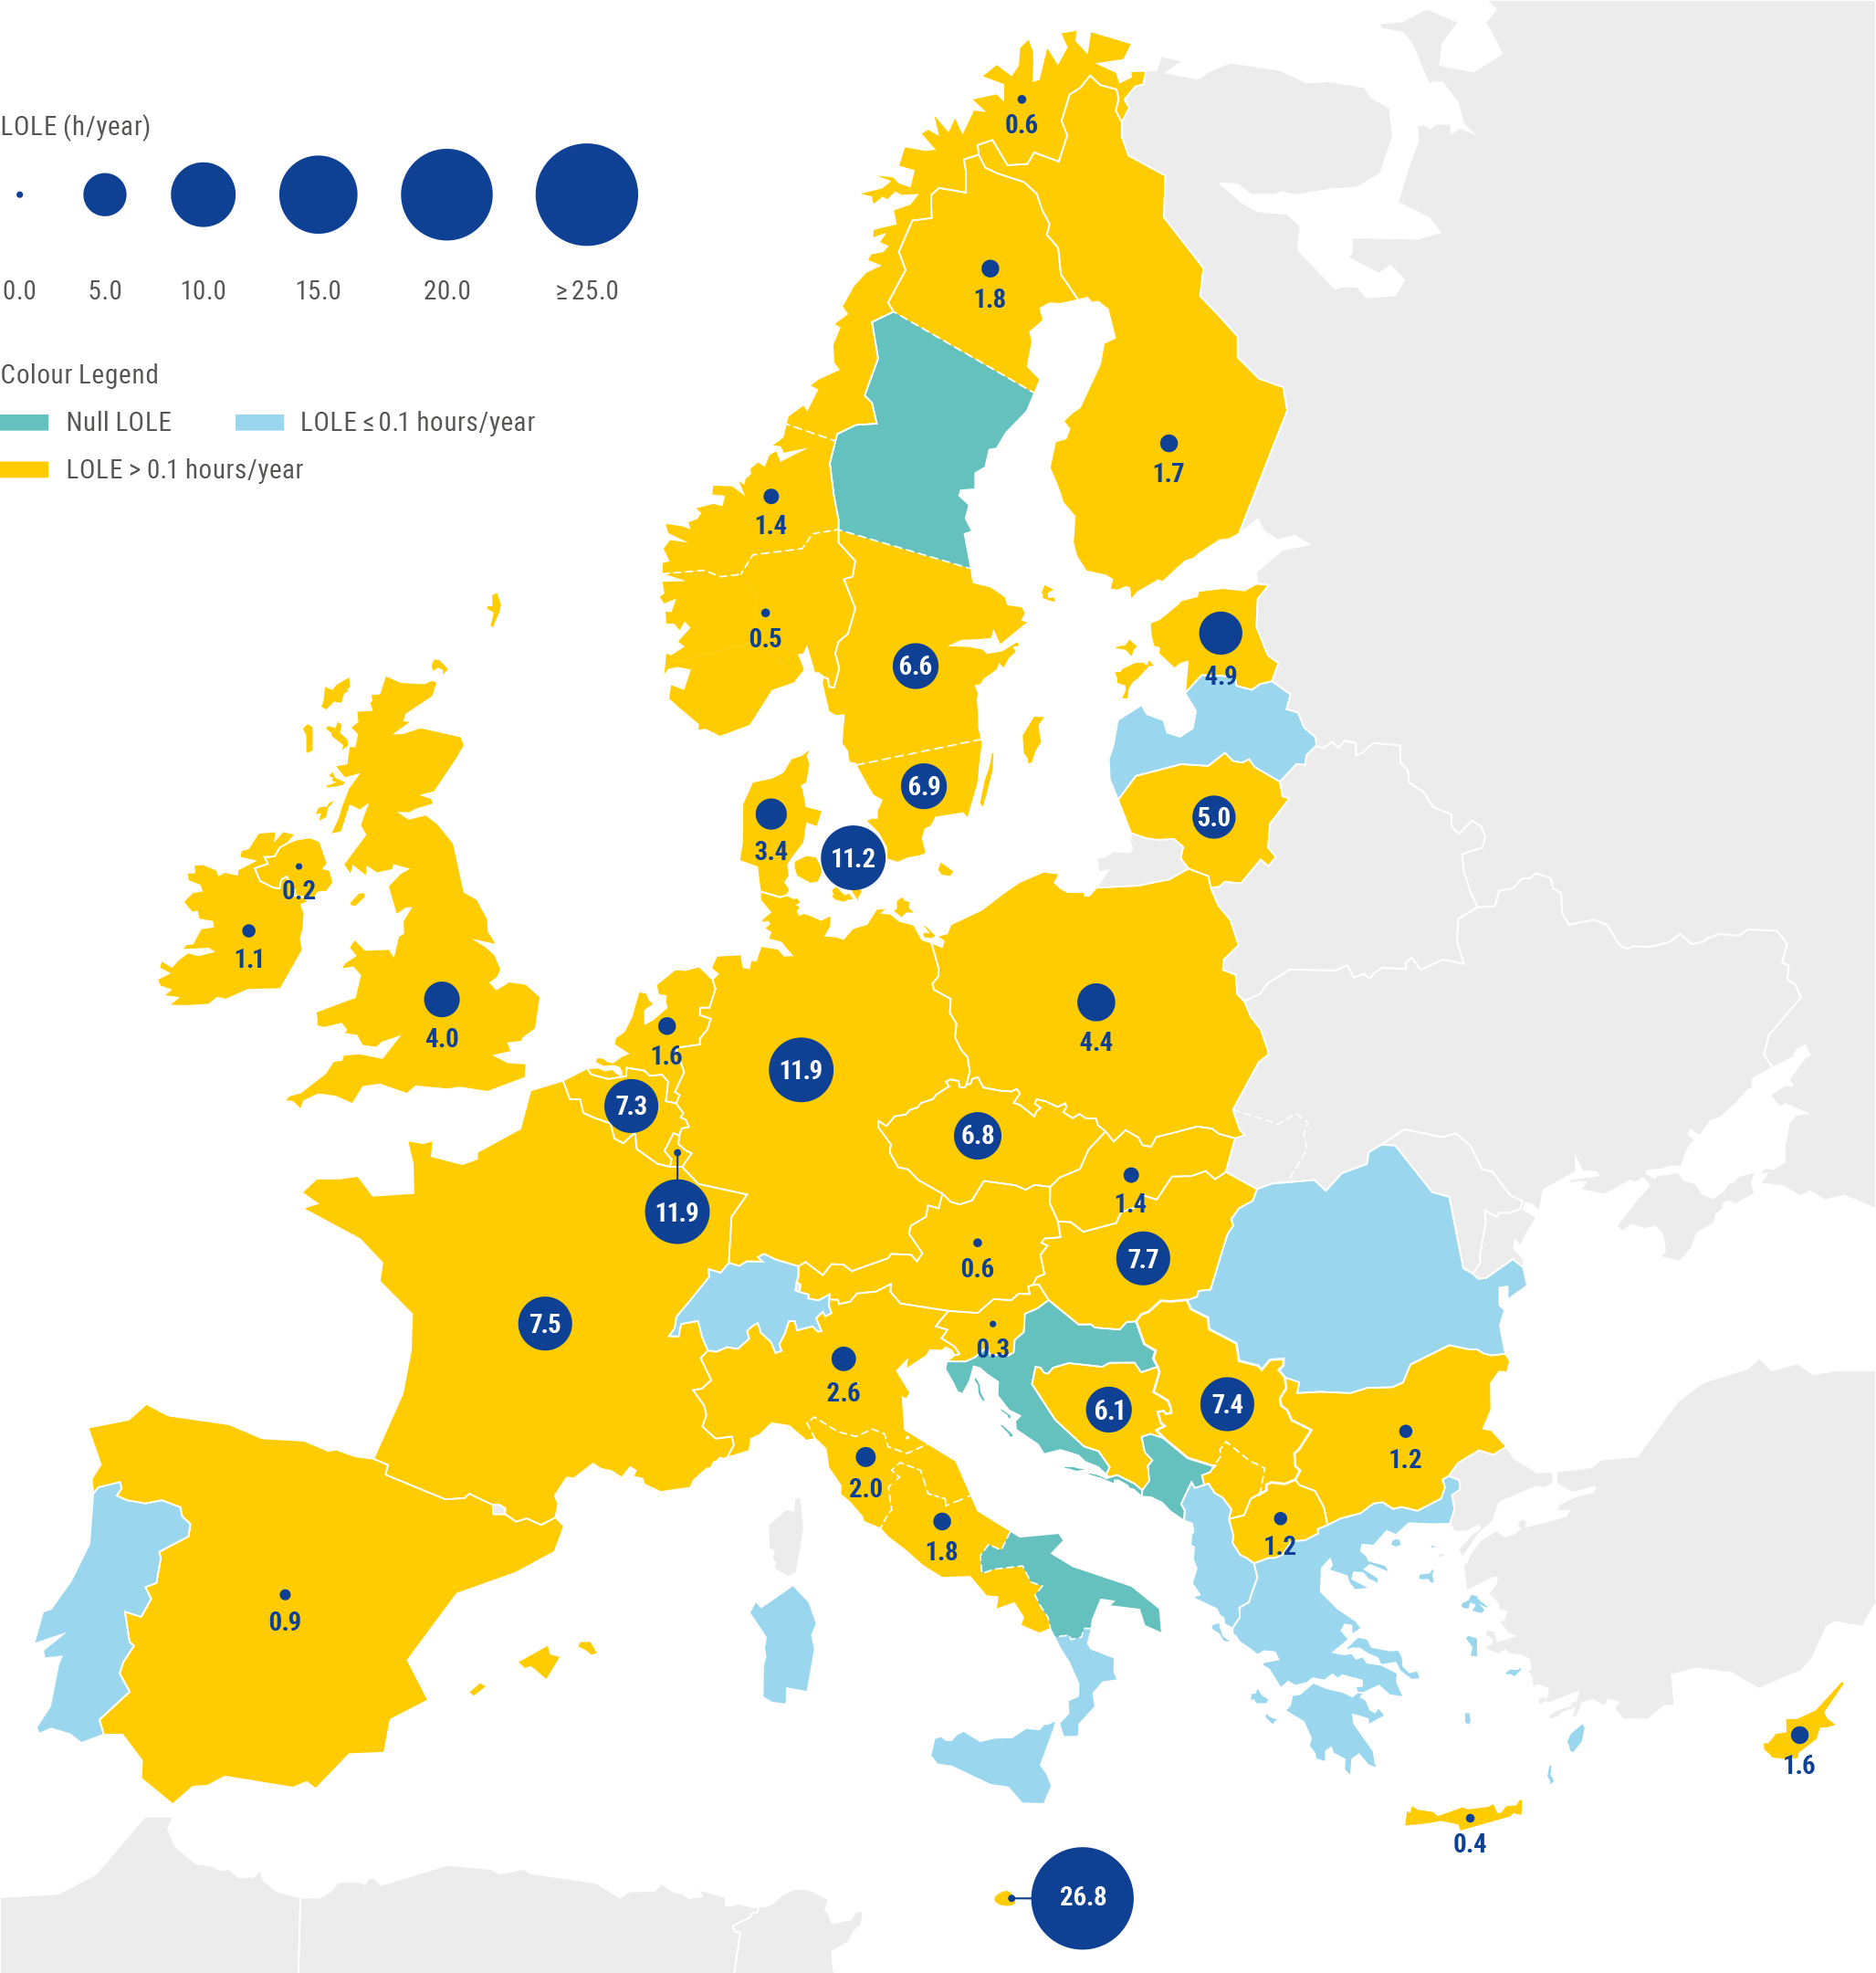
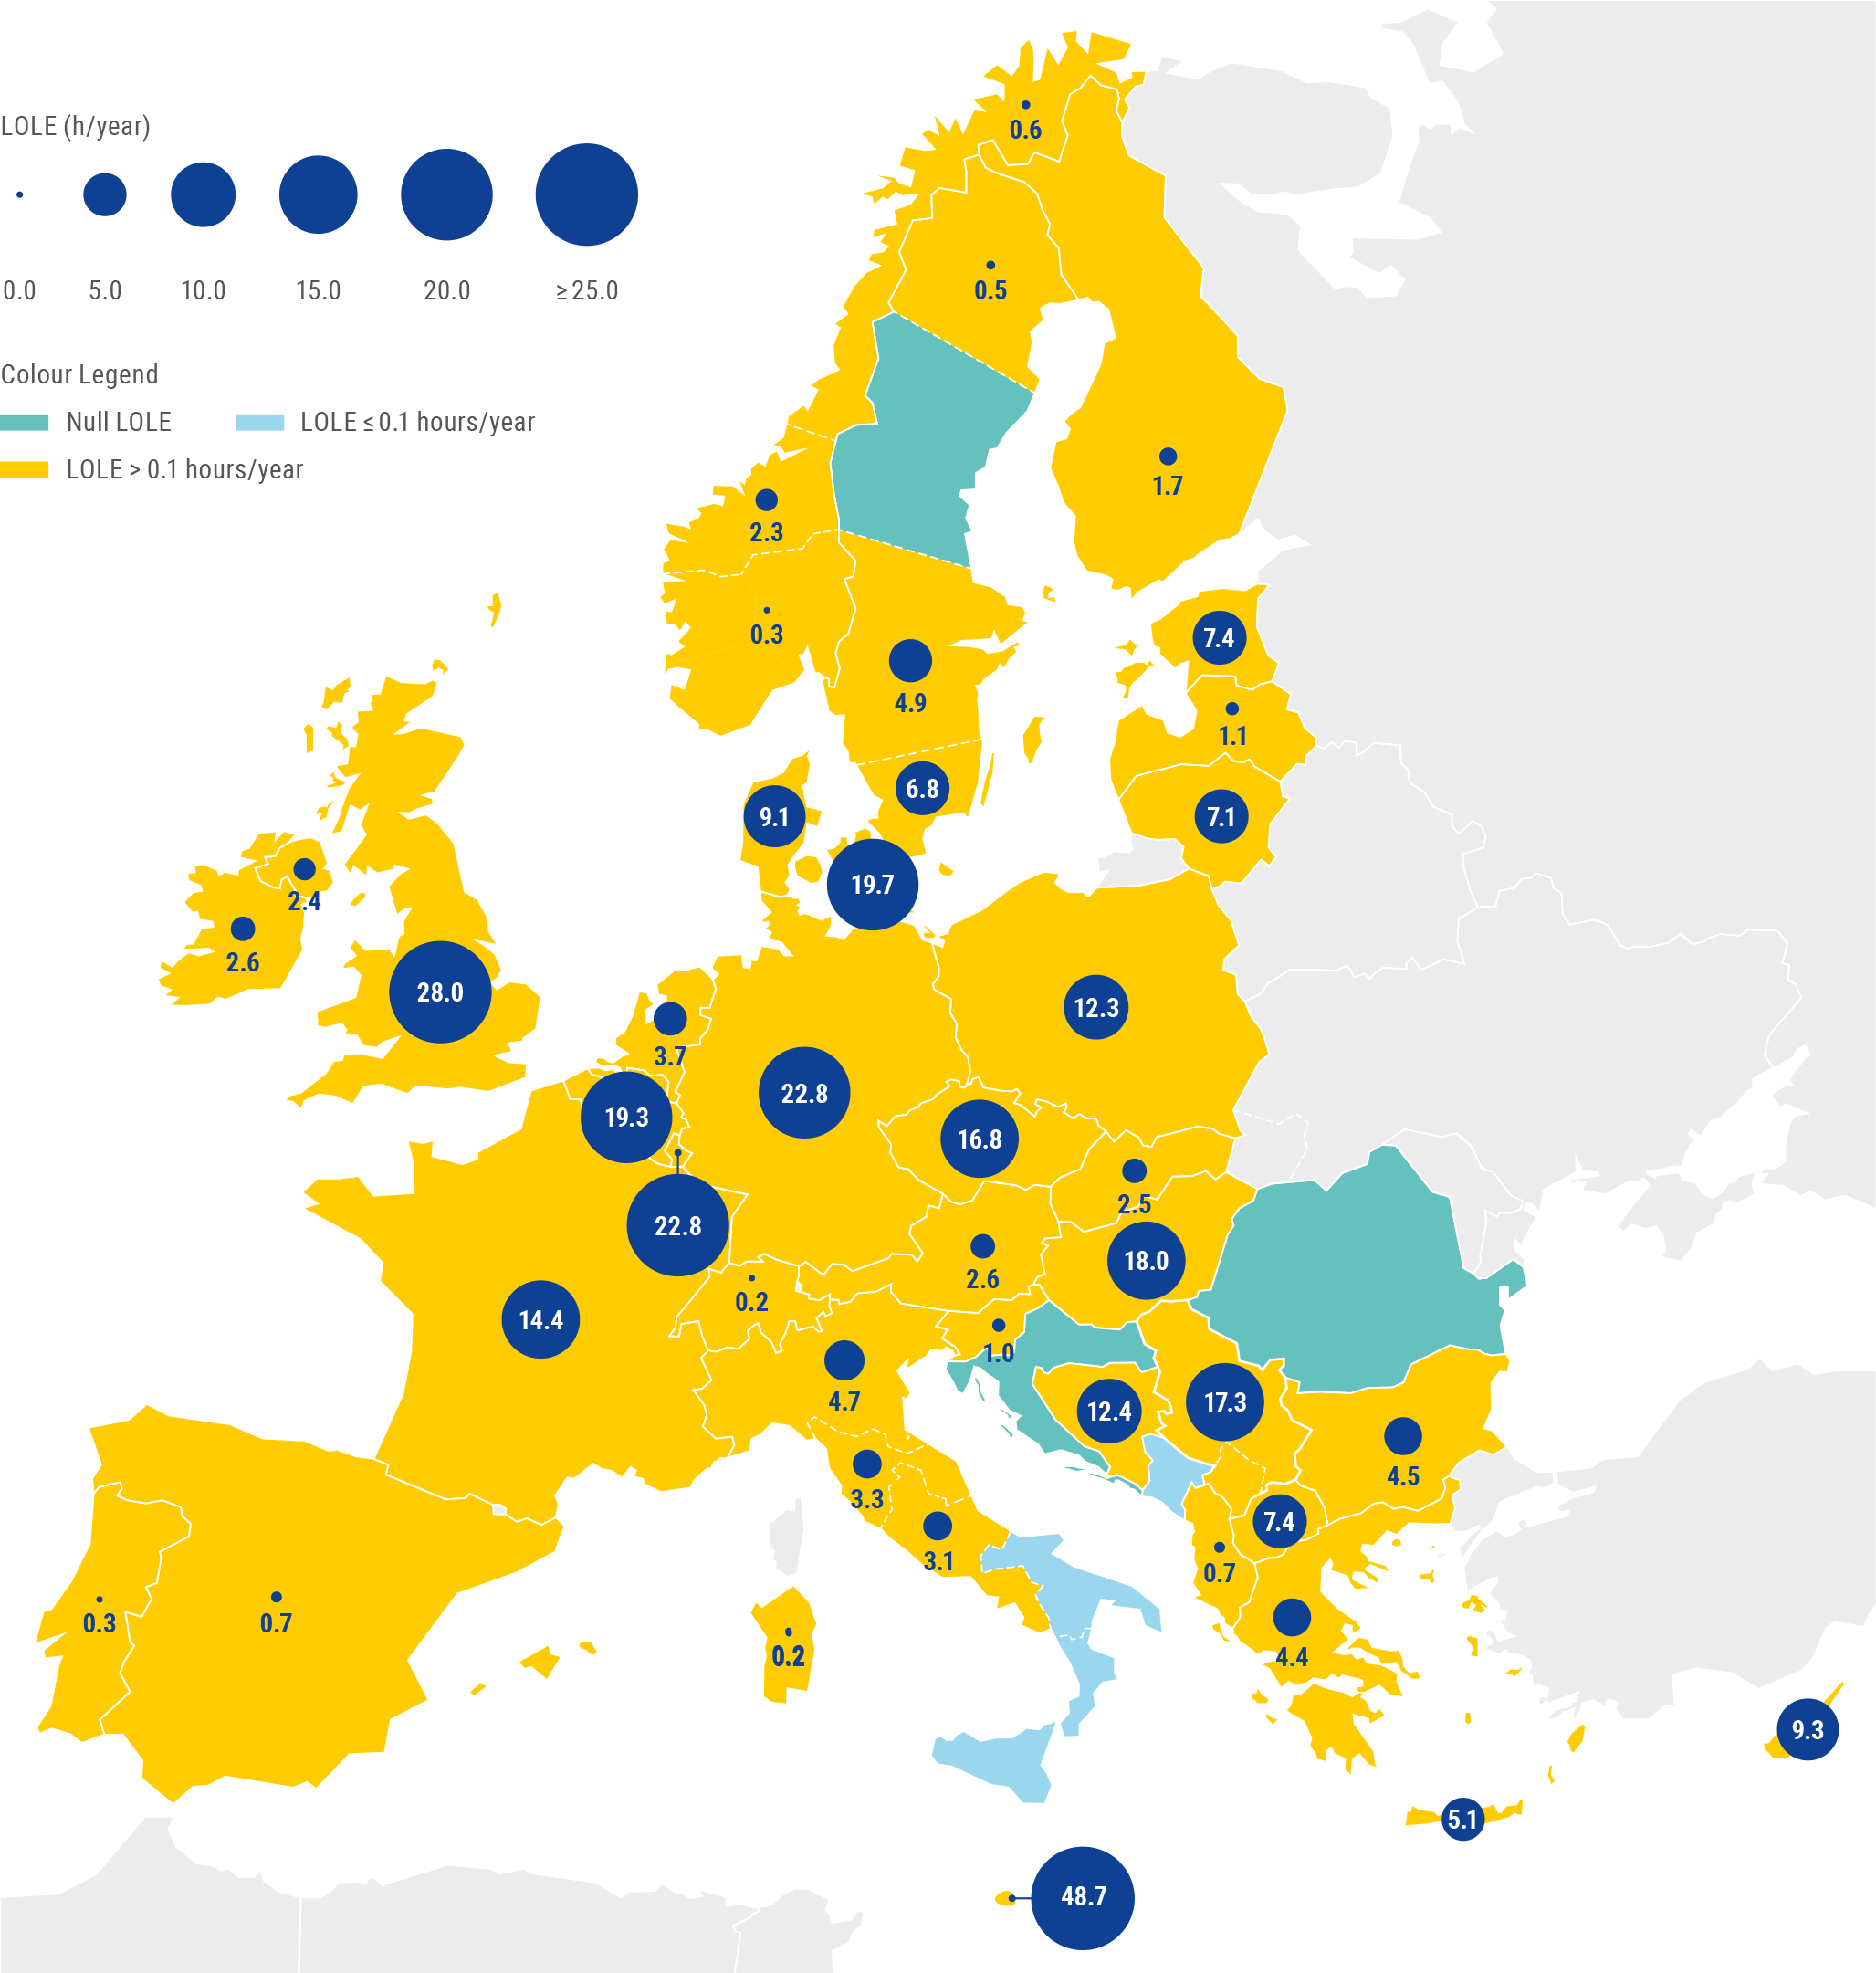
- *Both scenarios account for capacity mechanisms that already hold a capacity mechanism contract granted in any previous auction of any existing or approved capacity mechanism at the time of the assessment, including DSR, which is relevant for Poland in target year 2025.
 ENTSO-E