ENTSO-E
ERAA 2023Visuals
Inputs
Demand
The left part of the visual shows yearly demand values as well as peak demand by Target Year for each Climate Year aggregated for the market zones selected in the map in the bottom right side of the visual. The upper right side shows the proportion of selected market zones expressed as the average yearly demands across Target Years and Climate Years.

PECD energy variables
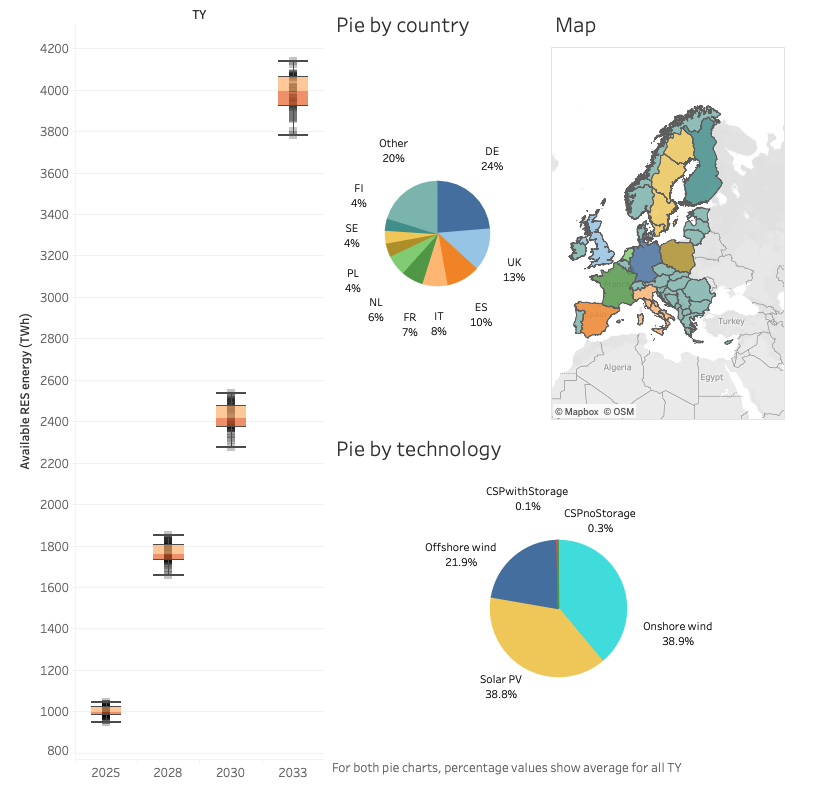
The visual shows the yearly available RES energy that can be generated by these technologies and injected in the grid for each climate years, provided there is sufficient demand (assuming 100% of the available energy is injected in the grid). The available energy is calculated based on the installed capacities of the reported technologies and wind & solar load factor profiles . The left part of the visual shows yearly avaiable RES values by Target Year for each Climate Year aggregated for the market zones selected in the map in the top right side of the visual. The pie chart in the top right side shows the proportion of selected market zones expressed as the average available RES energy across Target Years and Climate Years. The pie chart in the bottom right side shows the proportion of technologies expressed as the average available RES energy across Target Years and Climate Years.
PECD hydro inflows
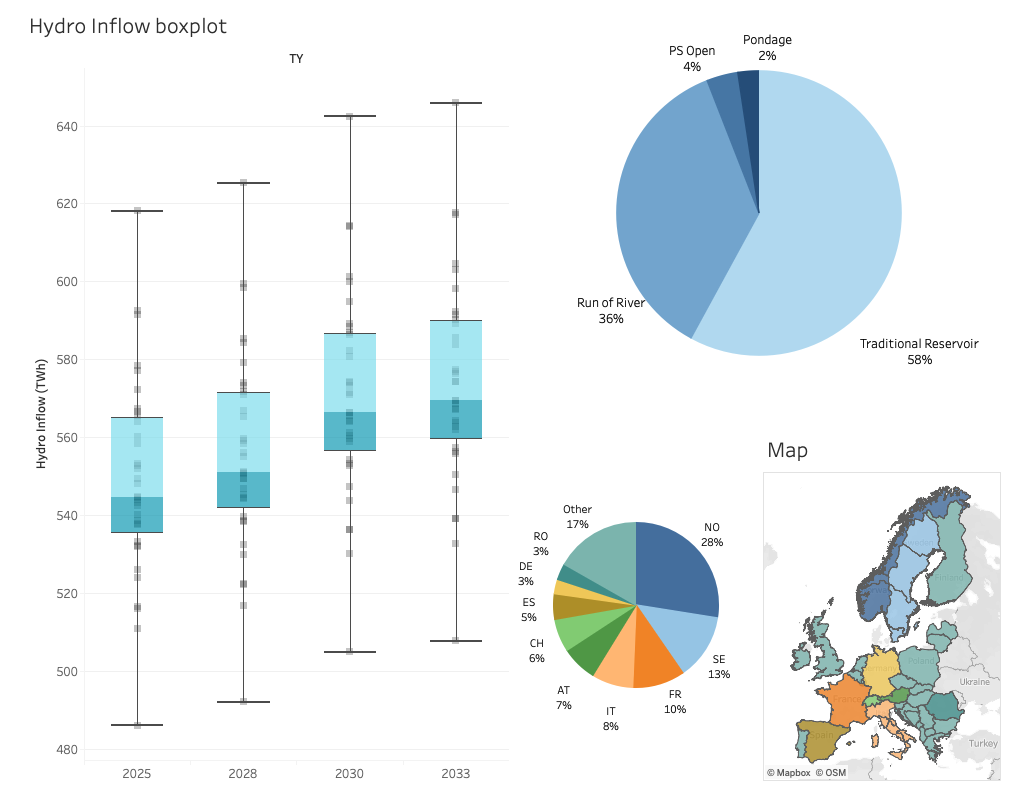
The visual shows the yearly energy content of water inflows of hydro storage technologies, which is either injected in the grid or being stored, under all climate years. The left part of the visual shows yearly hydro inflows values by Target Year for each Climate Year aggregated for the market zones selected in the map in the bottom right side of the visual. The pie chart in the bottom right side shows the proportion of selected market zones expressed as the average hydro inflows across Target Years and Climate Years. The pie chart in the top right side shows the proportion of technologies expressed as the average hydro inflows across Target Years and Climate Years.
Resource capacities under ‘National Estimates’ scenario
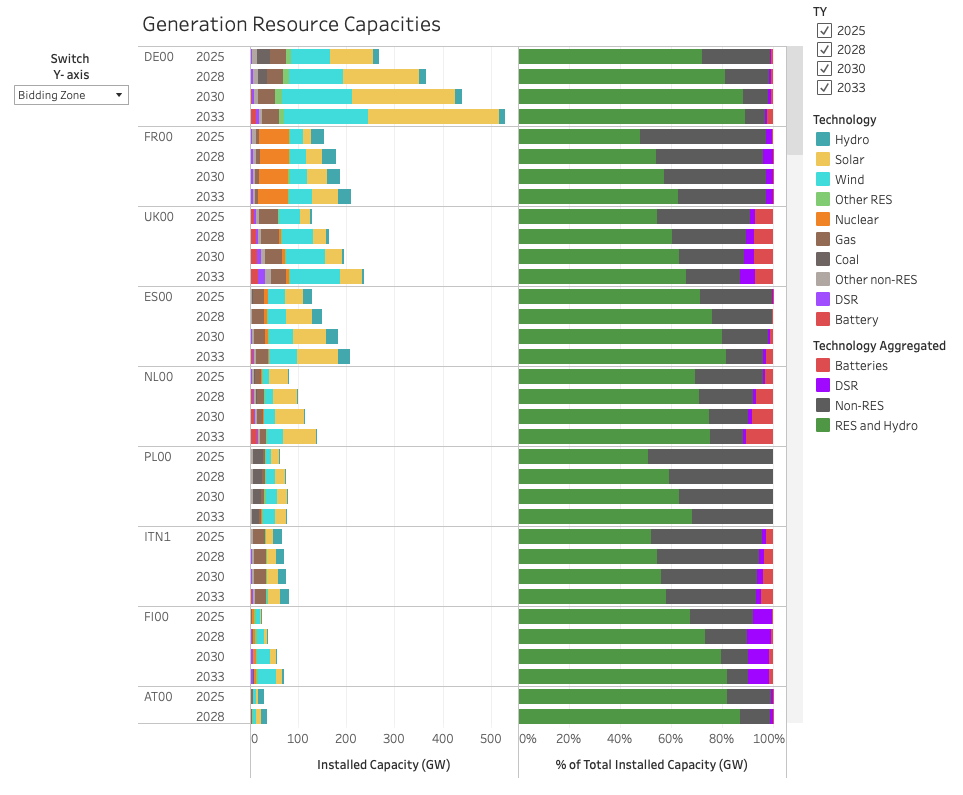
The visual shows – for TYs 2025, 2028, 2030 and 2033 – the resource capacities (net generation capacity and DSR) by country and technology in the left part and the capacity mix of renewable energy sources and hydro, non-RES, batteries and DSR capacities by country in the right part. Resource capacity values represent generation/injection/load reduction capacities.
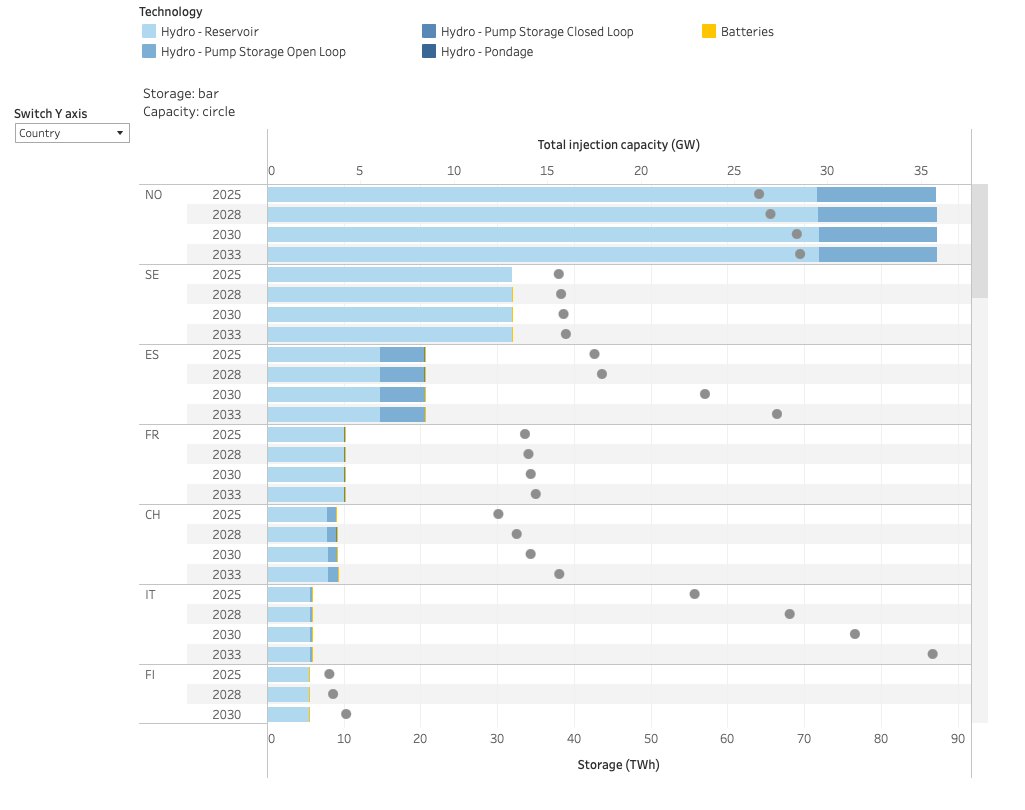
Storage capacities under 'National Estimates' scenario
The visual shows the energy content of the storage capacities (stacked bars) expressed in TWh for each storage technology, as well as the total injection capacity of these technologies (dots) expressed in GW per market zone and target year.
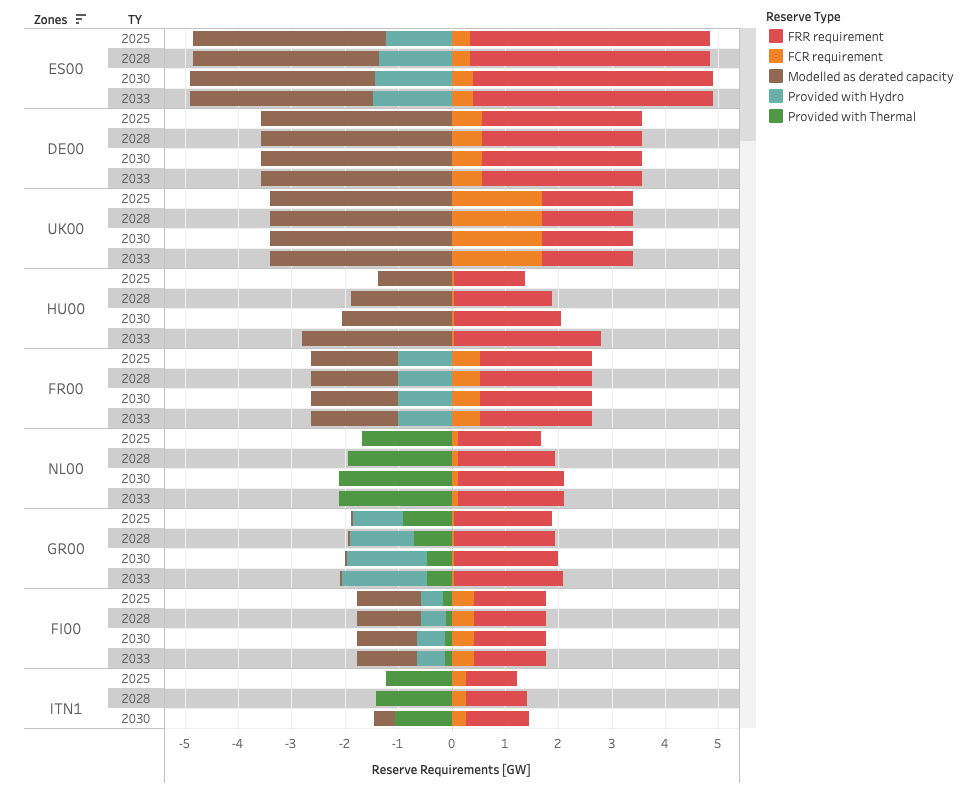
Reserves requirements
The visual shows the reserves requirements expressed in GW for each reserve requirement (FRR, FCR), as well as the means used to provide that reserve requirement (Hydro, Thermal or modelled as derated capacity), per market zone and target year.
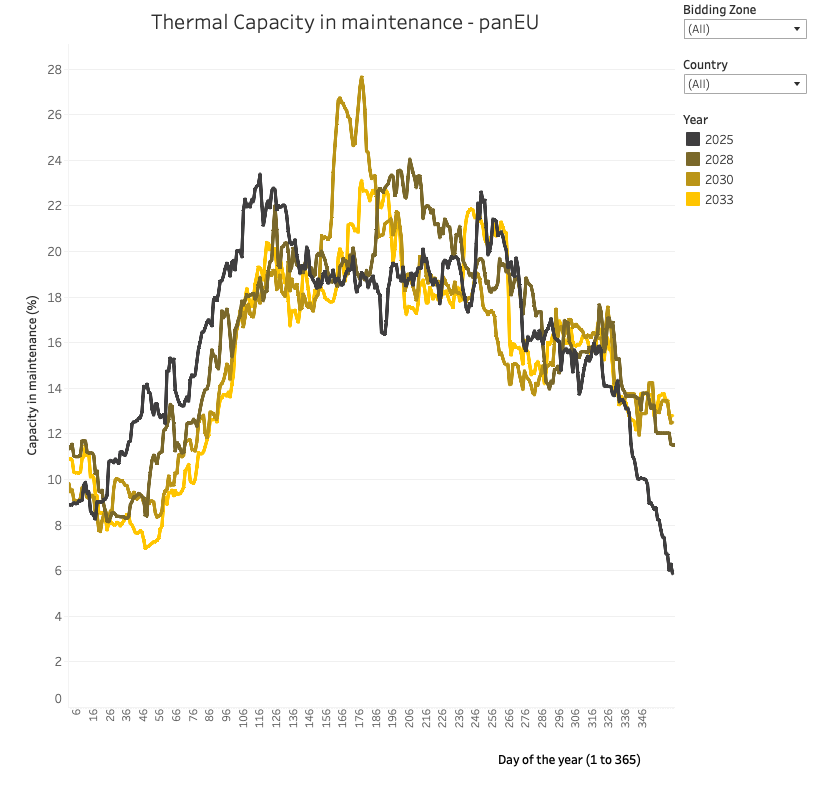
Thermal capacity maintenance under 'National Estimates' scenario
The visual shows the daily ratio of thermal capacity in maintenance, expressed as a percentage of the thermal installed capacity. Values are shown per market zone and county, and per target year.
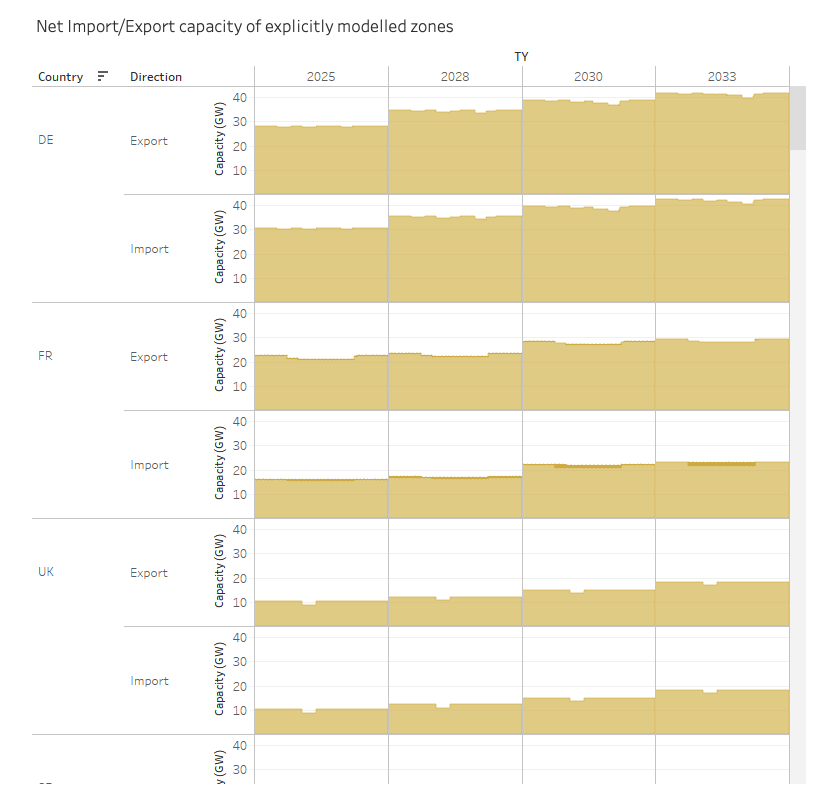
Net Import/Export capacities of explicitly modelled zones
The visual shows the Net Transfer Capacities at the import and export sides per country and target year, at an hourly resolution.
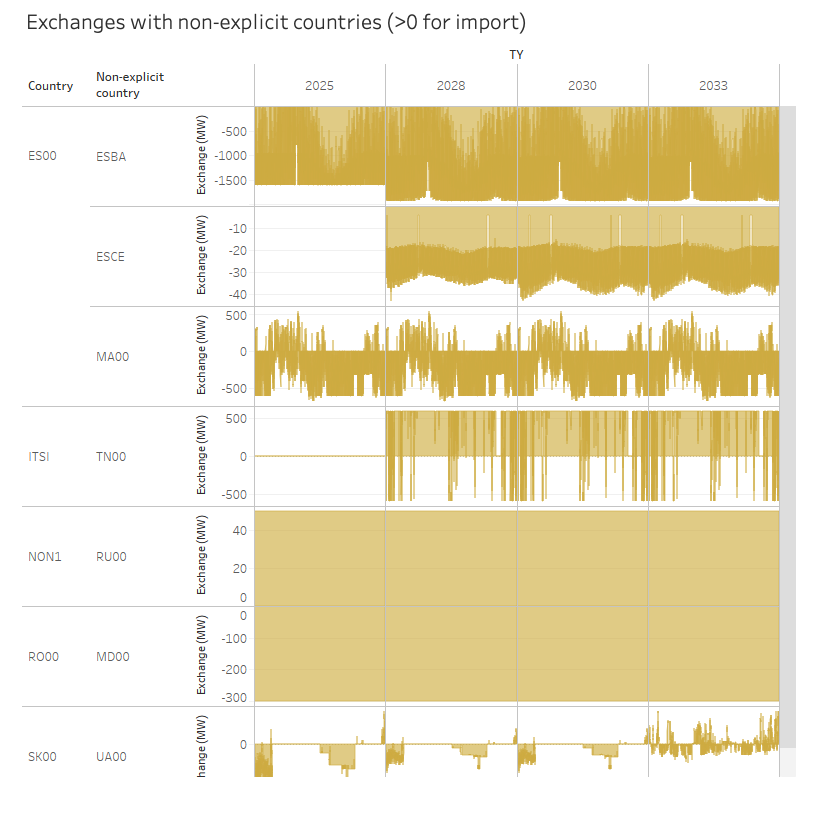
Exchanges with non-explicit modelled zones
The visual shows the exchanges between explicitly modelled zones and implicitly modelled zones (non-explicit countries) per country and target year, at an hourly resolution.
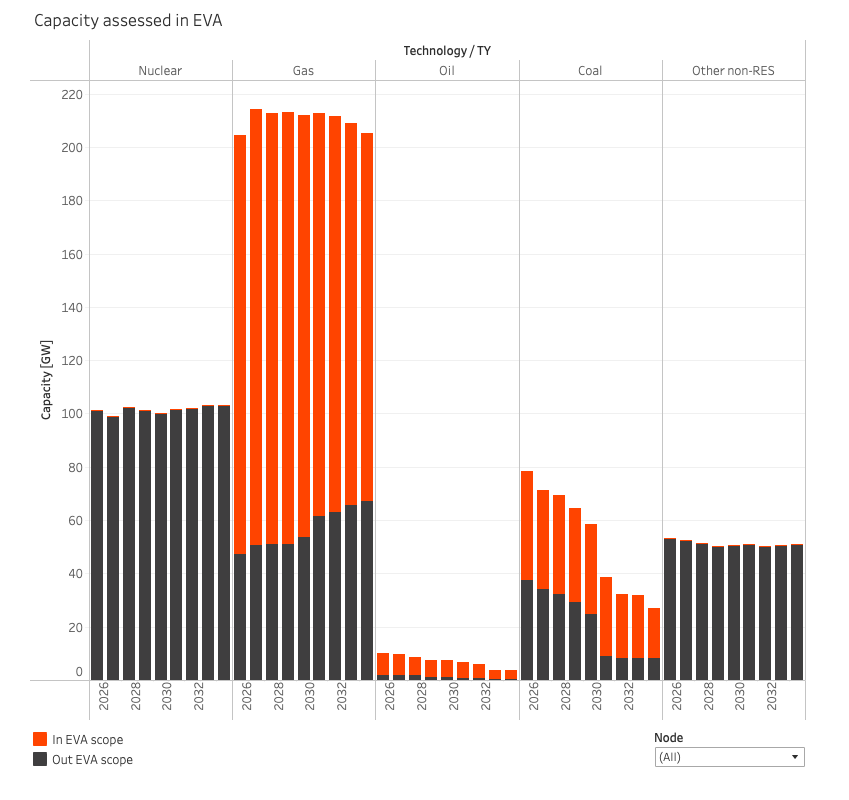
Technologies and capacities subject to the EVA
The visual illustrates the installed capacity subject to the EVA assessment as well as the capacity excluded from it per Target Year.
Outputs
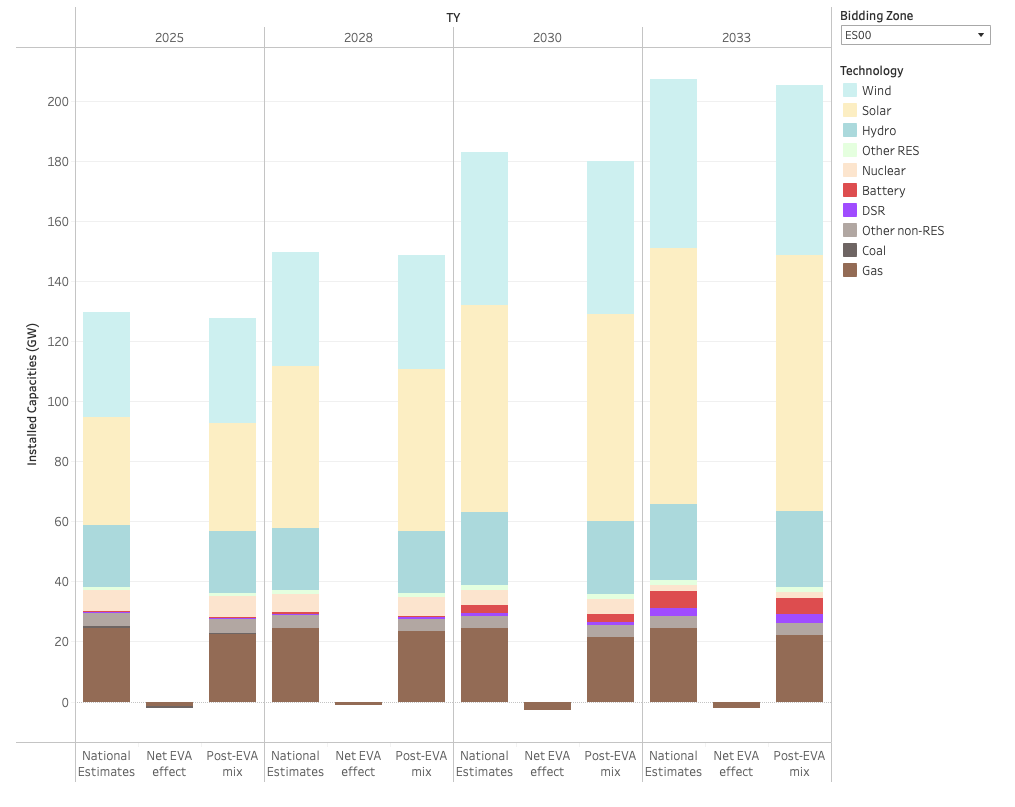
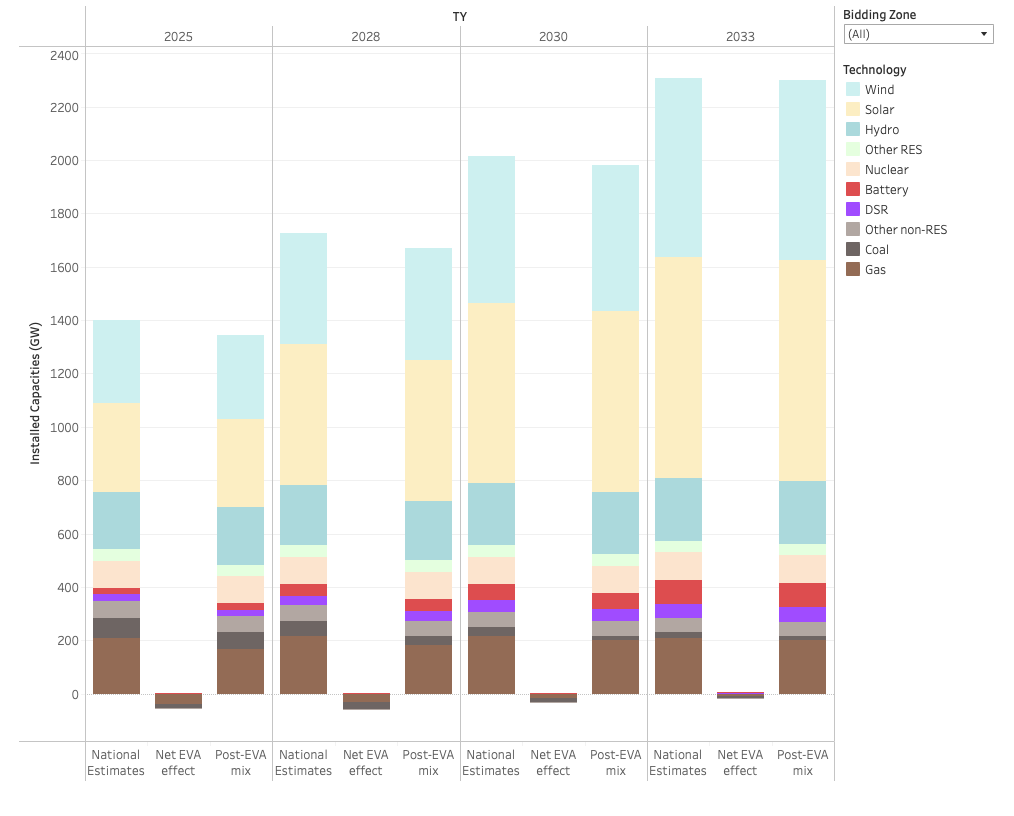
EVA results (Scenario A - Central Reference)
Net effect of the EVA on the capacity mix.
EVA results (Scenario B - Sensitivity)
Net effect of the EVA on the capacity mix.
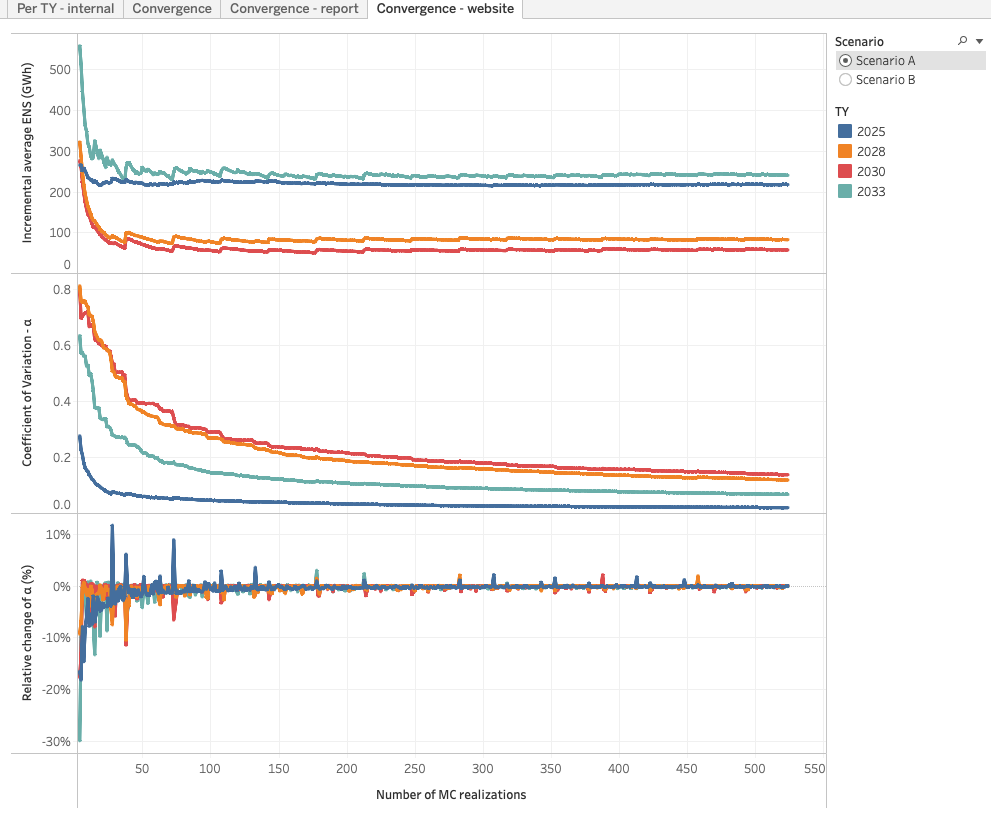
ENS Convergence
Incremental average ENS, Coefficient of variation α and relative change of α evolution.